29
/fr/
fr
AIzaSyAYiBZKx7MnpbEhh9jyipgxe19OcubqV5w
April 1, 2024
208055
Netherlands
NLD
true
2
1
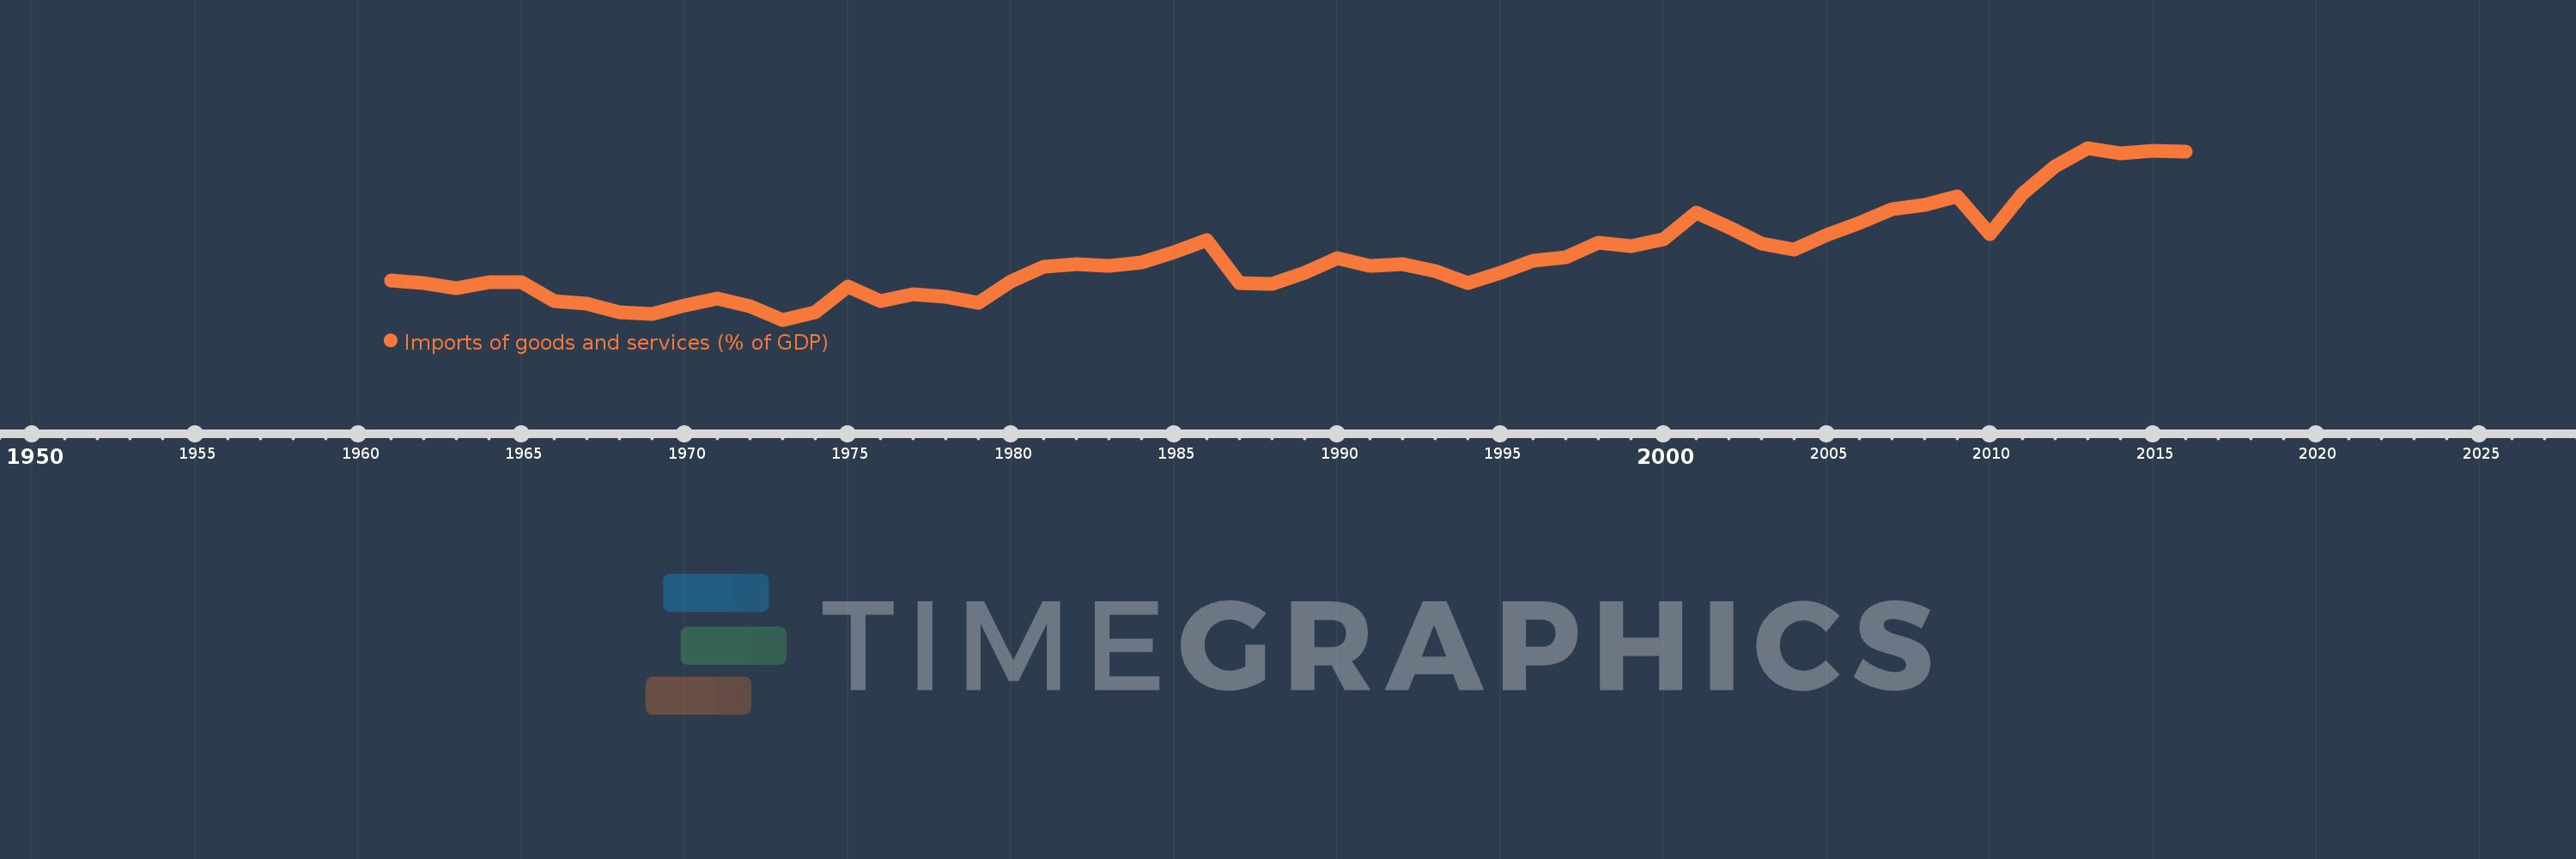
Imports of goods and services (% of GDP)
2016,2015,2014,2013,2012,2011,2010,2009,2008,2007,2006,2005,2004,2003,2002,2001,2000,1999,1998,1997,1996,1995,1994,1993,1992,1991,1990,1989,1988,1987,1986,1985,1984,1983,1982,1981,1980,1979,1978,1977,1976,1975,1974,1973,1972,1971,1970,1969,1968,1967,1966,1965,1964,1963,1962,1961
Cette statistique dans les autres pays:
AfghanistanAlbaniaAlgeriaAngolaAntigua and BarbudaArab WorldArgentinaArmeniaArubaAustraliaAustriaAzerbaijanBahamas, TheBahrainBangladeshBarbadosBelarusBelgiumBelizeBeninBermudaBhutanBoliviaBosnia and HerzegovinaBotswanaBrazilBrunei DarussalamBulgariaBurkina FasoBurundiCabo VerdeCambodiaCameroonCanadaCaribbean small statesCentral African RepublicCentral Europe and the BalticsChadChileChinaColombiaComorosCongo, Dem. Rep.Congo, Rep.Costa RicaCote d'IvoireCroatiaCubaCyprusCzech RepublicDenmarkDjiboutiDominicaDominican RepublicEarly-demographic dividendEast Asia & PacificEast Asia & Pacific (excluding high income)East Asia & Pacific (IDA & IBRD countries)EcuadorEgypt, Arab Rep.El SalvadorEquatorial GuineaEritreaEstoniaEthiopiaEuro areaEurope & Central AsiaEurope & Central Asia (excluding high income)Europe & Central Asia (IDA & IBRD countries)European UnionFaroe IslandsFijiFinlandFragile and conflict affected situationsFranceFrench PolynesiaGabonGambia, TheGeorgiaGermanyGhanaGreeceGrenadaGuatemalaGuineaGuinea-BissauGuyanaHaitiHeavily indebted poor countries (HIPC)High incomeHondurasHong Kong SAR, ChinaHungaryIBRD onlyIcelandIDA & IBRD totalIDA blendIDA onlyIDA totalIndiaIndonesiaIran, Islamic Rep.IraqIrelandIsraelItalyJamaicaJapanJordanKazakhstanKenyaKiribatiKorea, Rep.KosovoKuwaitKyrgyz RepublicLao PDRLate-demographic dividendLatin America & Caribbean Latin America & Caribbean (excluding high income)Latin America & the Caribbean (IDA & IBRD countries)LatviaLeast developed countries: UN classificationLebanonLesothoLiberiaLibyaLithuaniaLow & middle incomeLow incomeLower middle incomeLuxembourgMacao SAR, ChinaMacedonia, FYRMadagascarMalawiMalaysiaMaldivesMaliMaltaMauritaniaMauritiusMexicoMicronesia, Fed. Sts.Middle East & North AfricaMiddle East & North Africa (excluding high income)Middle East & North Africa (IDA & IBRD countries)Middle incomeMoldovaMongoliaMontenegroMoroccoMozambiqueMyanmarNamibiaNepalNetherlandsNew CaledoniaNew ZealandNicaraguaNigerNigeriaNorth AmericaNorwayOECD membersOmanOther small statesPacific island small statesPakistanPalauPanamaPapua New GuineaParaguayPeruPhilippinesPolandPortugalPost-demographic dividendPre-demographic dividendPuerto RicoQatarRomaniaRussian FederationRwandaSamoaSaudi ArabiaSenegalSerbiaSeychellesSierra LeoneSingaporeSlovak RepublicSloveniaSmall statesSolomon IslandsSomaliaSouth AfricaSouth AsiaSouth Asia (IDA & IBRD)South SudanSpainSri LankaSt. Kitts and NevisSt. LuciaSt. Vincent and the GrenadinesSub-Saharan Africa Sub-Saharan Africa (excluding high income)Sub-Saharan Africa (IDA & IBRD countries)SudanSurinameSwazilandSwedenSwitzerlandSyrian Arab RepublicTajikistanTanzaniaThailandTimor-LesteTogoTongaTrinidad and TobagoTunisiaTurkeyTurkmenistanUgandaUkraineUnited Arab EmiratesUnited KingdomUnited StatesUpper middle incomeUruguayUzbekistanVanuatuVenezuela, RBVietnamWest Bank and GazaWorldYemen, Rep.ZambiaZimbabwe La ligne de temps
Cette échelle de temps montre un graphique de 1961 année à 2016 année Netherlands. Les données jusqu'à 1960 année ne sont pas présentés. Quantité d'observations actuelles selon dates: 56.
Source (désignation):
Les indicateurs du développement mondiale
Source (organisation):
World Bank national accounts data, and OECD National Accounts data files.
Catégories:
Economy & Growth, Trade
Dernière mise à jour
23 avr. 2017
Les indicateurs de changement de valeurs selon les années
Minimum:
39.458
1 janv. 1973
Maximum:
72.335
1 janv. 2013
Pour la date d''observation
Valeur
Changement absolu
Le changement par rapport à la valeur précédente
1 janv. 1961
46.994
+46.994
0.0%
1 janv. 1962
46.456
-0.537
-1.14%
1 janv. 1963
45.529
-0.927
-2.0%
1 janv. 1964
46.713
+1.183
2.6%
1 janv. 1965
46.685
-0.028
-0.06%
1 janv. 1966
42.986
-3.699
-7.92%
1 janv. 1967
42.557
-0.428
-1.0%
1 janv. 1968
40.892
-1.665
-3.91%
1 janv. 1969
40.493
-0.399
-0.98%
1 janv. 1970
42.172
+1.68
4.15%
1 janv. 1971
43.447
+1.275
3.02%
1 janv. 1972
42.105
-1.342
-3.09%
1 janv. 1973
39.458
-2.647
-6.29%
1 janv. 1974
40.88
+1.422
3.6%
1 janv. 1975
45.806
+4.925
12.05%
1 janv. 1976
43.1
-2.705
-5.91%
1 janv. 1977
44.366
+1.266
2.94%
1 janv. 1978
43.874
-0.492
-1.11%
1 janv. 1979
42.71
-1.164
-2.65%
1 janv. 1980
46.842
+4.132
9.67%
1 janv. 1981
49.572
+2.73
5.83%
1 janv. 1982
50.146
+0.574
1.16%
1 janv. 1983
49.769
-0.377
-0.75%
1 janv. 1984
50.393
+0.625
1.25%
1 janv. 1985
52.317
+1.924
3.82%
1 janv. 1986
54.759
+2.442
4.67%
1 janv. 1987
46.5
-8.259
-15.08%
1 janv. 1988
46.376
-0.123
-0.27%
1 janv. 1989
48.41
+2.033
4.38%
1 janv. 1990
51.176
+2.766
5.71%
1 janv. 1991
49.783
-1.393
-2.72%
1 janv. 1992
50.166
+0.383
0.77%
1 janv. 1993
48.784
-1.381
-2.75%
1 janv. 1994
46.482
-2.302
-4.72%
1 janv. 1995
48.374
+1.892
4.07%
1 janv. 1996
50.765
+2.39
4.94%
1 janv. 1997
51.483
+0.718
1.41%
1 janv. 1998
54.201
+2.718
5.28%
1 janv. 1999
53.611
-0.591
-1.09%
1 janv. 2000
54.896
+1.285
2.4%
1 janv. 2001
59.959
+5.063
9.22%
1 janv. 2002
57.163
-2.796
-4.66%
1 janv. 2003
53.96
-3.203
-5.6%
1 janv. 2004
52.945
-1.014
-1.88%
1 janv. 2005
55.612
+2.667
5.04%
1 janv. 2006
57.937
+2.325
4.18%
1 janv. 2007
60.547
+2.61
4.5%
1 janv. 2008
61.448
+0.901
1.49%
1 janv. 2009
63.016
+1.568
2.55%
1 janv. 2010
55.826
-7.19
-11.41%
1 janv. 2011
63.591
+7.765
13.91%
1 janv. 2012
68.817
+5.226
8.22%
1 janv. 2013
72.335
+3.518
5.11%
1 janv. 2014
71.314
-1.02
-1.41%
1 janv. 2015
71.723
+0.409
0.57%
1 janv. 2016
71.684
-0.039
-0.05%
Classement des pays selon les statistiques actuelles par années


Commentaires: