29
/fr/
fr
AIzaSyAYiBZKx7MnpbEhh9jyipgxe19OcubqV5w
April 1, 2024
111059
Congo, Rep.
COG
true
2
1
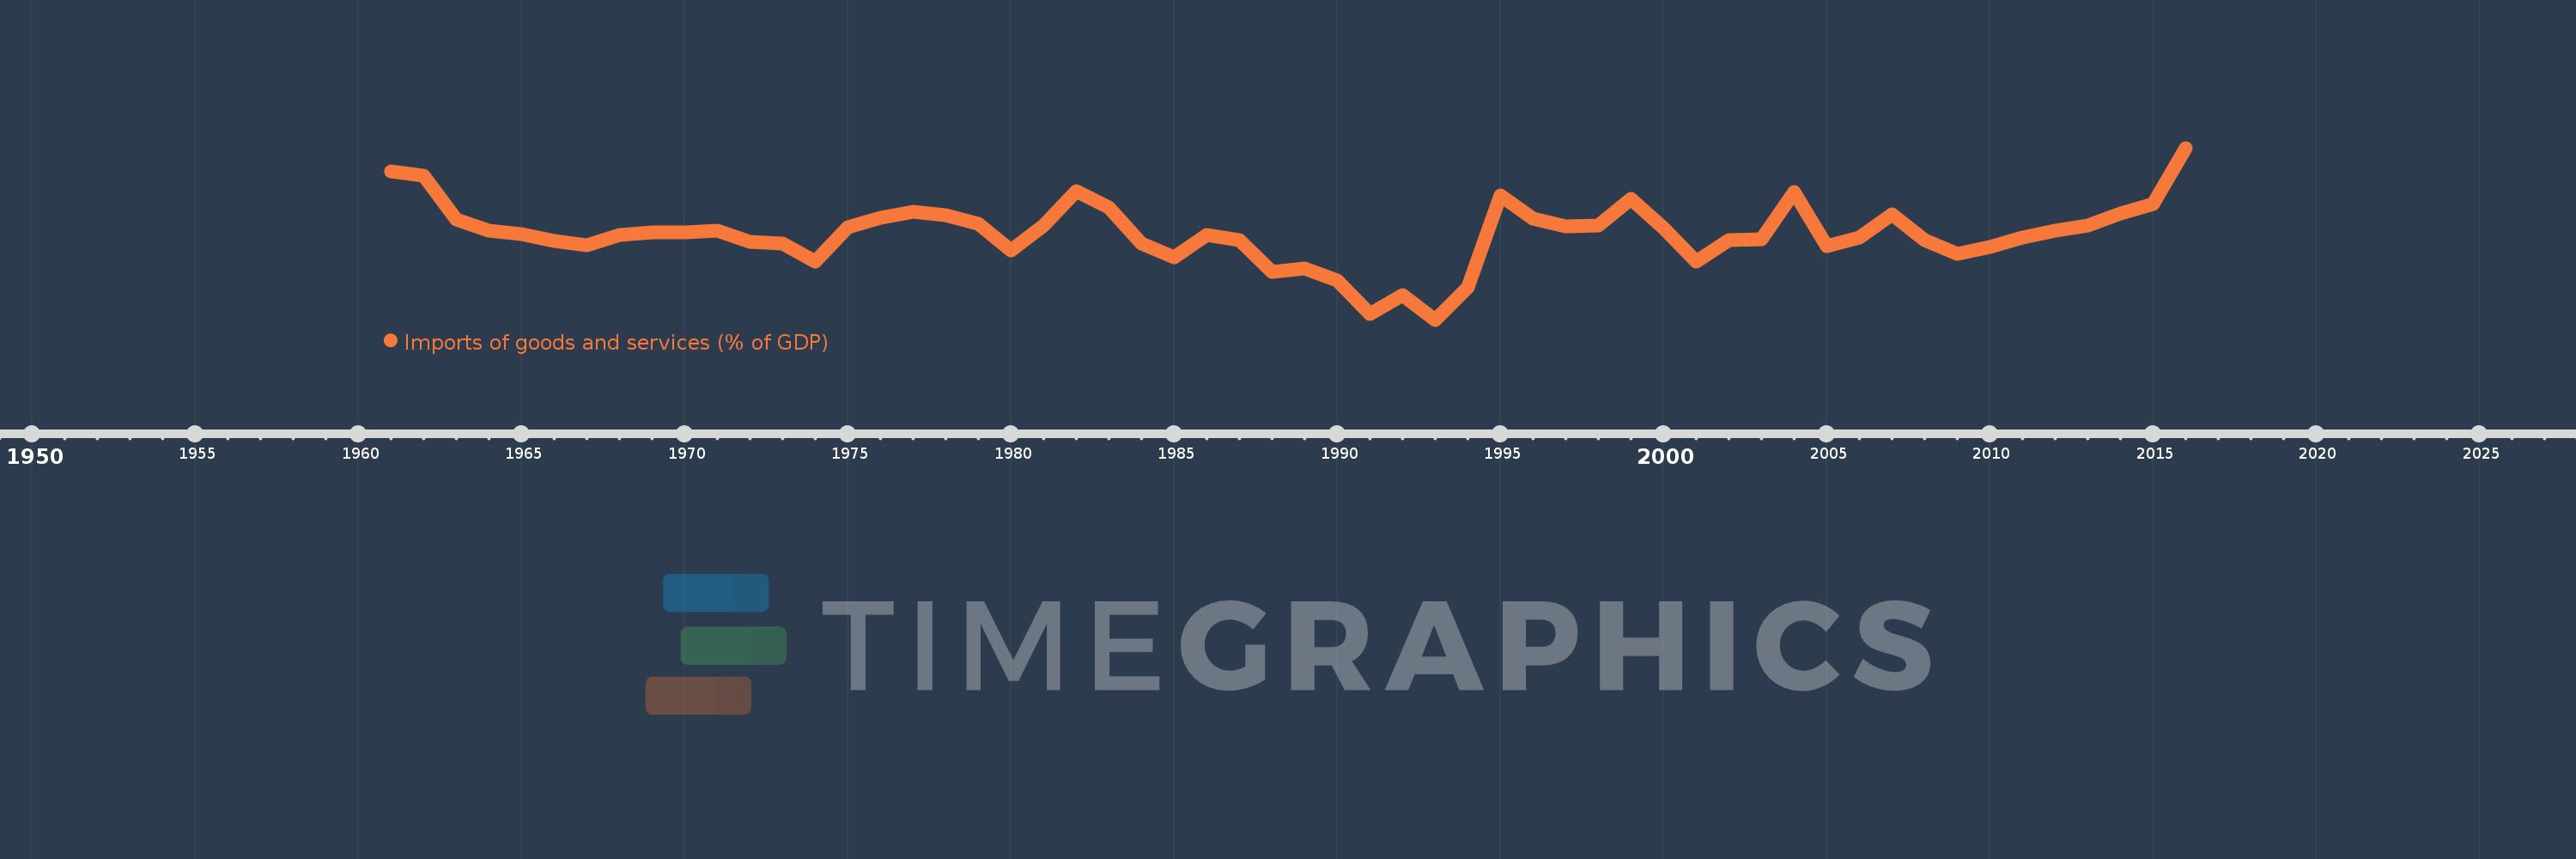
Imports of goods and services (% of GDP)
2016,2015,2014,2013,2012,2011,2010,2009,2008,2007,2006,2005,2004,2003,2002,2001,2000,1999,1998,1997,1996,1995,1994,1993,1992,1991,1990,1989,1988,1987,1986,1985,1984,1983,1982,1981,1980,1979,1978,1977,1976,1975,1974,1973,1972,1971,1970,1969,1968,1967,1966,1965,1964,1963,1962,1961
Cette statistique dans les autres pays:
AfghanistanAlbaniaAlgeriaAngolaAntigua and BarbudaArab WorldArgentinaArmeniaArubaAustraliaAustriaAzerbaijanBahamas, TheBahrainBangladeshBarbadosBelarusBelgiumBelizeBeninBermudaBhutanBoliviaBosnia and HerzegovinaBotswanaBrazilBrunei DarussalamBulgariaBurkina FasoBurundiCabo VerdeCambodiaCameroonCanadaCaribbean small statesCentral African RepublicCentral Europe and the BalticsChadChileChinaColombiaComorosCongo, Dem. Rep.Congo, Rep.Costa RicaCote d'IvoireCroatiaCubaCyprusCzech RepublicDenmarkDjiboutiDominicaDominican RepublicEarly-demographic dividendEast Asia & PacificEast Asia & Pacific (excluding high income)East Asia & Pacific (IDA & IBRD countries)EcuadorEgypt, Arab Rep.El SalvadorEquatorial GuineaEritreaEstoniaEthiopiaEuro areaEurope & Central AsiaEurope & Central Asia (excluding high income)Europe & Central Asia (IDA & IBRD countries)European UnionFaroe IslandsFijiFinlandFragile and conflict affected situationsFranceFrench PolynesiaGabonGambia, TheGeorgiaGermanyGhanaGreeceGrenadaGuatemalaGuineaGuinea-BissauGuyanaHaitiHeavily indebted poor countries (HIPC)High incomeHondurasHong Kong SAR, ChinaHungaryIBRD onlyIcelandIDA & IBRD totalIDA blendIDA onlyIDA totalIndiaIndonesiaIran, Islamic Rep.IraqIrelandIsraelItalyJamaicaJapanJordanKazakhstanKenyaKiribatiKorea, Rep.KosovoKuwaitKyrgyz RepublicLao PDRLate-demographic dividendLatin America & Caribbean Latin America & Caribbean (excluding high income)Latin America & the Caribbean (IDA & IBRD countries)LatviaLeast developed countries: UN classificationLebanonLesothoLiberiaLibyaLithuaniaLow & middle incomeLow incomeLower middle incomeLuxembourgMacao SAR, ChinaMacedonia, FYRMadagascarMalawiMalaysiaMaldivesMaliMaltaMauritaniaMauritiusMexicoMicronesia, Fed. Sts.Middle East & North AfricaMiddle East & North Africa (excluding high income)Middle East & North Africa (IDA & IBRD countries)Middle incomeMoldovaMongoliaMontenegroMoroccoMozambiqueMyanmarNamibiaNepalNetherlandsNew CaledoniaNew ZealandNicaraguaNigerNigeriaNorth AmericaNorwayOECD membersOmanOther small statesPacific island small statesPakistanPalauPanamaPapua New GuineaParaguayPeruPhilippinesPolandPortugalPost-demographic dividendPre-demographic dividendPuerto RicoQatarRomaniaRussian FederationRwandaSamoaSaudi ArabiaSenegalSerbiaSeychellesSierra LeoneSingaporeSlovak RepublicSloveniaSmall statesSolomon IslandsSomaliaSouth AfricaSouth AsiaSouth Asia (IDA & IBRD)South SudanSpainSri LankaSt. Kitts and NevisSt. LuciaSt. Vincent and the GrenadinesSub-Saharan Africa Sub-Saharan Africa (excluding high income)Sub-Saharan Africa (IDA & IBRD countries)SudanSurinameSwazilandSwedenSwitzerlandSyrian Arab RepublicTajikistanTanzaniaThailandTimor-LesteTogoTongaTrinidad and TobagoTunisiaTurkeyTurkmenistanUgandaUkraineUnited Arab EmiratesUnited KingdomUnited StatesUpper middle incomeUruguayUzbekistanVanuatuVenezuela, RBVietnamWest Bank and GazaWorldYemen, Rep.ZambiaZimbabwe La ligne de temps
Cette échelle de temps montre un graphique de 1961 année à 2016 année Congo, Rep.. Les données jusqu'à 1960 année ne sont pas présentés. Quantité d'observations actuelles selon dates: 56.
Source (désignation):
Les indicateurs du développement mondiale
Source (organisation):
World Bank national accounts data, and OECD National Accounts data files.
Catégories:
Economy & Growth, Trade
Dernière mise à jour
23 avr. 2017
Les indicateurs de changement de valeurs selon les années
Minimum:
16.449
1 janv. 1993
Maximum:
96.37
1 janv. 2016
Pour la date d''observation
Valeur
Changement absolu
Le changement par rapport à la valeur précédente
1 janv. 1961
85.607
+85.607
0.0%
1 janv. 1962
83.661
-1.946
-2.27%
1 janv. 1963
62.952
-20.709
-24.75%
1 janv. 1964
57.848
-5.104
-8.11%
1 janv. 1965
56.449
-1.399
-2.42%
1 janv. 1966
53.086
-3.363
-5.96%
1 janv. 1967
51.107
-1.979
-3.73%
1 janv. 1968
55.822
+4.715
9.23%
1 janv. 1969
57.235
+1.413
2.53%
1 janv. 1970
56.894
-0.341
-0.6%
1 janv. 1971
57.763
+0.869
1.53%
1 janv. 1972
52.649
-5.114
-8.85%
1 janv. 1973
51.787
-0.862
-1.64%
1 janv. 1974
43.377
-8.41
-16.24%
1 janv. 1975
59.475
+16.097
37.11%
1 janv. 1976
63.747
+4.272
7.18%
1 janv. 1977
66.556
+2.809
4.41%
1 janv. 1978
65.266
-1.29
-1.94%
1 janv. 1979
61.069
-4.197
-6.43%
1 janv. 1980
48.627
-12.442
-20.37%
1 janv. 1981
60.128
+11.5
23.65%
1 janv. 1982
76.094
+15.966
26.55%
1 janv. 1983
68.507
-7.587
-9.97%
1 janv. 1984
51.764
-16.743
-24.44%
1 janv. 1985
45.623
-6.141
-11.86%
1 janv. 1986
56.005
+10.382
22.76%
1 janv. 1987
53.669
-2.337
-4.17%
1 janv. 1988
38.621
-15.048
-28.04%
1 janv. 1989
40.425
+1.804
4.67%
1 janv. 1990
34.829
-5.596
-13.84%
1 janv. 1991
19.042
-15.787
-45.33%
1 janv. 1992
28.05
+9.008
47.31%
1 janv. 1993
16.449
-11.601
-41.36%
1 janv. 1994
31.34
+14.891
90.53%
1 janv. 1995
74.219
+42.879
136.82%
1 janv. 1996
63.608
-10.611
-14.3%
1 janv. 1997
59.949
-3.658
-5.75%
1 janv. 1998
60.162
+0.212
0.35%
1 janv. 1999
72.624
+12.462
20.72%
1 janv. 2000
59.104
-13.52
-18.62%
1 janv. 2001
43.613
-15.491
-26.21%
1 janv. 2002
53.312
+9.7
22.24%
1 janv. 2003
53.94
+0.627
1.18%
1 janv. 2004
76.049
+22.11
40.99%
1 janv. 2005
50.838
-25.211
-33.15%
1 janv. 2006
54.505
+3.667
7.21%
1 janv. 2007
65.62
+11.115
20.39%
1 janv. 2008
53.523
-12.097
-18.43%
1 janv. 2009
47.002
-6.521
-12.18%
1 janv. 2010
50.205
+3.203
6.81%
1 janv. 2011
54.698
+4.492
8.95%
1 janv. 2012
57.836
+3.138
5.74%
1 janv. 2013
60.329
+2.494
4.31%
1 janv. 2014
66.072
+5.743
9.52%
1 janv. 2015
70.253
+4.181
6.33%
1 janv. 2016
96.37
+26.118
37.18%
Classement des pays selon les statistiques actuelles par années


Commentaires: