29
/fr/
fr
AIzaSyAYiBZKx7MnpbEhh9jyipgxe19OcubqV5w
April 1, 2024
203053
Mozambique
MOZ
true
2
1
Imports of goods and services (current US$)
2016,2015,2014,2013,2012,2011,2010,2009,2008,2007,2006,2005,2004,2003,2002,2001,2000,1999,1998,1997,1996,1995,1994,1993,1992,1991,1990,1989,1988,1987,1986,1985,1984,1983,1982,1981
Cette statistique dans les autres pays:
AfghanistanAlbaniaAlgeriaAngolaAntigua and BarbudaArab WorldArgentinaArmeniaArubaAustraliaAustriaAzerbaijanBahamas, TheBahrainBangladeshBarbadosBelarusBelgiumBelizeBeninBermudaBhutanBoliviaBosnia and HerzegovinaBotswanaBrazilBrunei DarussalamBulgariaBurkina FasoBurundiCabo VerdeCambodiaCameroonCanadaCaribbean small statesCentral African RepublicCentral Europe and the BalticsChadChileChinaColombiaComorosCongo, Dem. Rep.Congo, Rep.Costa RicaCote d'IvoireCroatiaCubaCyprusCzech RepublicDenmarkDjiboutiDominicaDominican RepublicEarly-demographic dividendEast Asia & PacificEast Asia & Pacific (excluding high income)East Asia & Pacific (IDA & IBRD countries)EcuadorEgypt, Arab Rep.El SalvadorEquatorial GuineaEritreaEstoniaEthiopiaEuro areaEurope & Central AsiaEurope & Central Asia (excluding high income)Europe & Central Asia (IDA & IBRD countries)European UnionFaroe IslandsFijiFinlandFragile and conflict affected situationsFranceFrench PolynesiaGabonGambia, TheGeorgiaGermanyGhanaGreeceGrenadaGuatemalaGuineaGuinea-BissauGuyanaHaitiHeavily indebted poor countries (HIPC)High incomeHondurasHong Kong SAR, ChinaHungaryIBRD onlyIcelandIDA & IBRD totalIDA blendIDA onlyIDA totalIndiaIndonesiaIran, Islamic Rep.IraqIrelandIsraelItalyJamaicaJapanJordanKazakhstanKenyaKiribatiKorea, Rep.KosovoKuwaitKyrgyz RepublicLao PDRLate-demographic dividendLatin America & Caribbean Latin America & Caribbean (excluding high income)Latin America & the Caribbean (IDA & IBRD countries)LatviaLeast developed countries: UN classificationLebanonLesothoLiberiaLibyaLithuaniaLow & middle incomeLow incomeLower middle incomeLuxembourgMacao SAR, ChinaMacedonia, FYRMadagascarMalawiMalaysiaMaldivesMaliMaltaMauritaniaMauritiusMexicoMicronesia, Fed. Sts.Middle East & North AfricaMiddle East & North Africa (excluding high income)Middle East & North Africa (IDA & IBRD countries)Middle incomeMoldovaMongoliaMontenegroMoroccoMozambiqueMyanmarNamibiaNepalNetherlandsNew CaledoniaNew ZealandNicaraguaNigerNigeriaNorth AmericaNorwayOECD membersOmanOther small statesPacific island small statesPakistanPalauPanamaPapua New GuineaParaguayPeruPhilippinesPolandPortugalPost-demographic dividendPre-demographic dividendPuerto RicoQatarRomaniaRussian FederationRwandaSamoaSaudi ArabiaSenegalSerbiaSeychellesSierra LeoneSingaporeSlovak RepublicSloveniaSmall statesSolomon IslandsSomaliaSouth AfricaSouth AsiaSouth Asia (IDA & IBRD)South SudanSpainSri LankaSt. Kitts and NevisSt. LuciaSt. Vincent and the GrenadinesSub-Saharan Africa Sub-Saharan Africa (excluding high income)Sub-Saharan Africa (IDA & IBRD countries)SudanSurinameSwazilandSwedenSwitzerlandSyrian Arab RepublicTajikistanTanzaniaThailandTimor-LesteTogoTongaTrinidad and TobagoTunisiaTurkeyTurkmenistanUgandaUkraineUnited Arab EmiratesUnited KingdomUnited StatesUpper middle incomeUruguayUzbekistanVanuatuVenezuela, RBVietnamWest Bank and GazaWorldYemen, Rep.ZambiaZimbabwe La ligne de temps
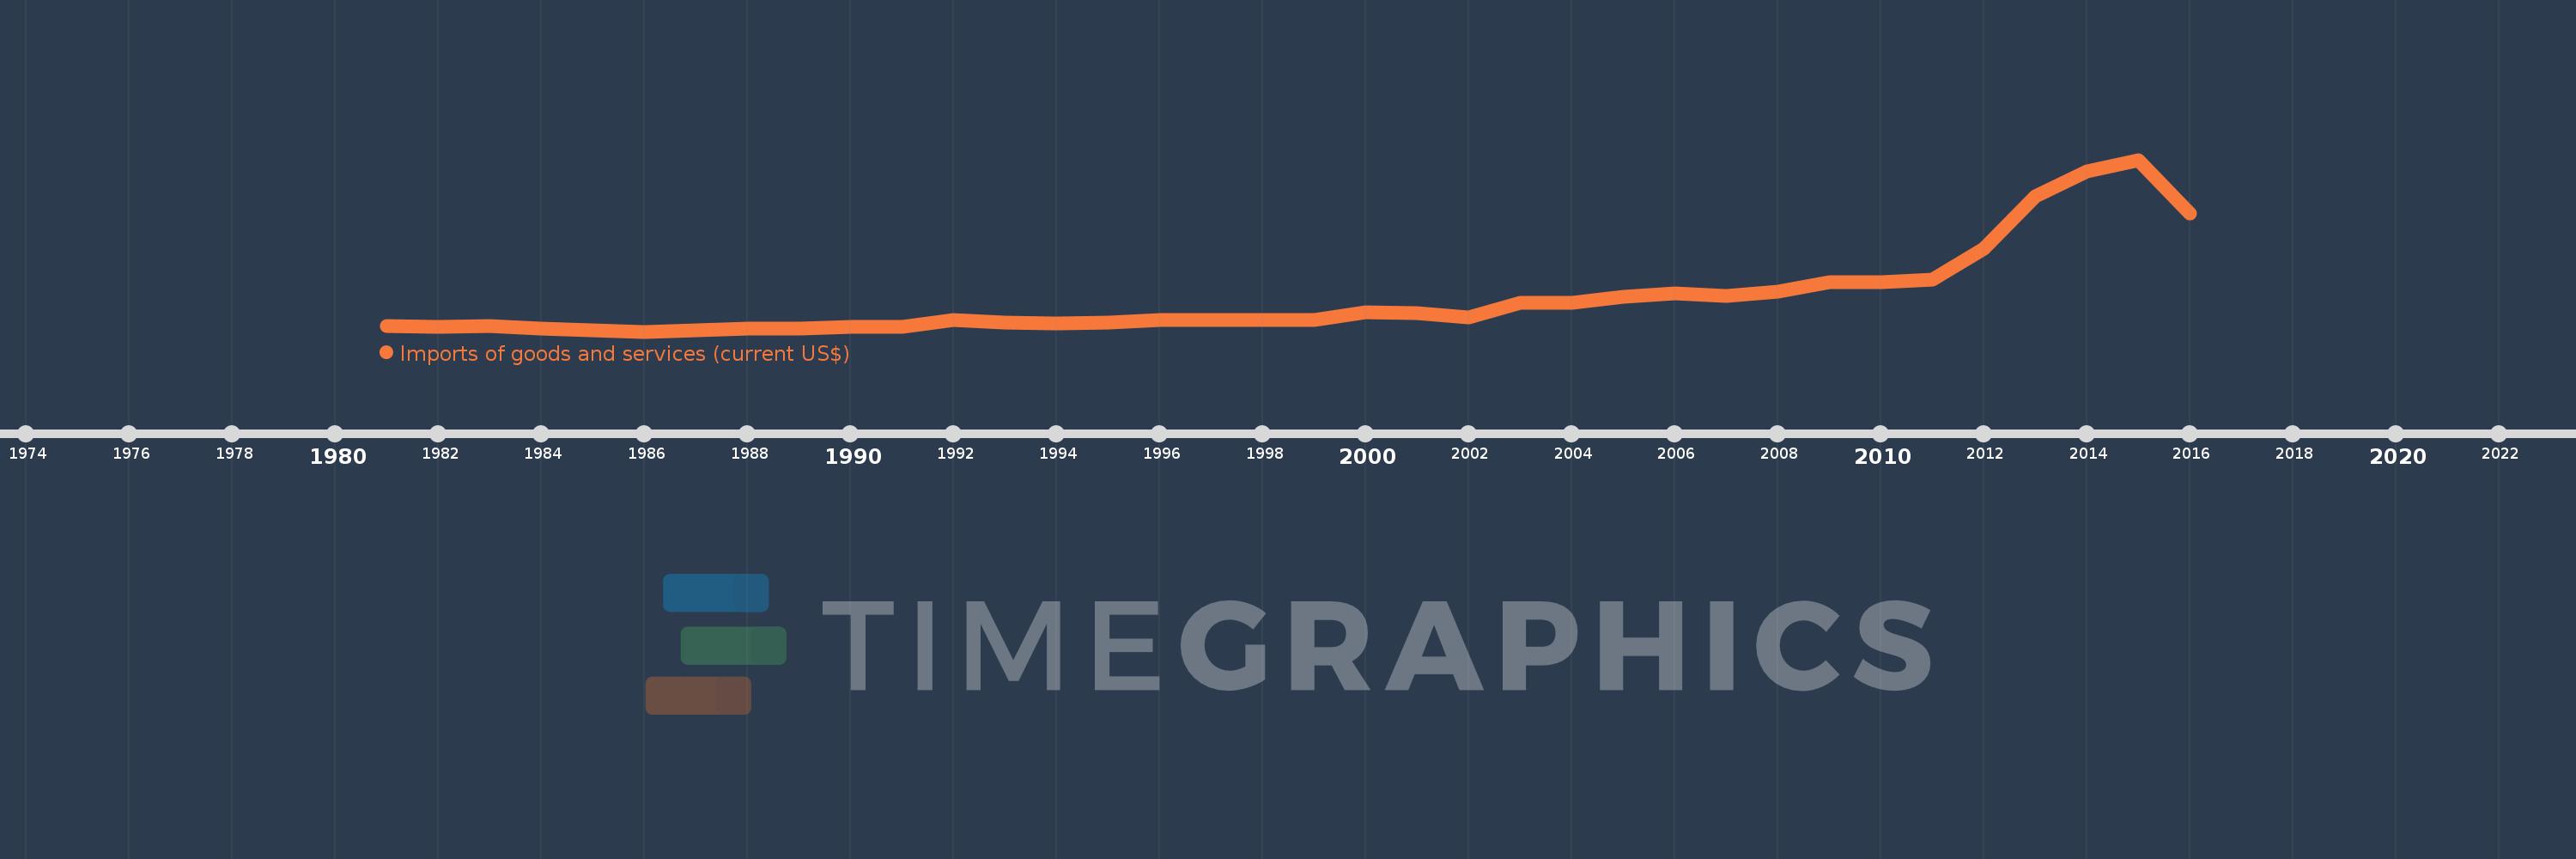
Cette échelle de temps montre un graphique de 1981 année à 2016 année Mozambique. Les données jusqu'à 1980 année ne sont pas présentés. Quantité d'observations actuelles selon dates: 36.
Source (désignation):
Les indicateurs du développement mondiale
Source (organisation):
World Bank national accounts data, and OECD National Accounts data files.
Catégories:
Economy & Growth, Trade
Dernière mise à jour
23 avr. 2017
Les indicateurs de changement de valeurs selon les années
Minimum:
511.187 mln.
1 janv. 1986
Maximum:
14.377 mds
1 janv. 2015
Pour la date d''observation
Valeur
Changement absolu
Le changement par rapport à la valeur précédente
1 janv. 1981
964.761 mln.
+964.761 mln.
0.0%
1 janv. 1982
909.682 mln.
-55.079 mln.
-5.71%
1 janv. 1983
947.668 mln.
+37.987 mln.
4.18%
1 janv. 1984
737.029 mln.
-210.639 mln.
-22.23%
1 janv. 1985
619.239 mln.
-117.791 mln.
-15.98%
1 janv. 1986
511.187 mln.
-108.052 mln.
-17.45%
1 janv. 1987
630.596 mln.
+119.409 mln.
23.36%
1 janv. 1988
738.762 mln.
+108.166 mln.
17.15%
1 janv. 1989
780.785 mln.
+42.023 mln.
5.69%
1 janv. 1990
894.376 mln.
+113.591 mln.
14.55%
1 janv. 1991
906.071 mln.
+11.695 mln.
1.31%
1 janv. 1992
1.441 mds
+535.016 mln.
59.05%
1 janv. 1993
1.242 mds
-199.534 mln.
-13.85%
1 janv. 1994
1.203 mds
-38.444 mln.
-3.1%
1 janv. 1995
1.274 mds
+70.485 mln.
5.86%
1 janv. 1996
1.435 mds
+161.78 mln.
12.7%
1 janv. 1997
1.429 mds
-6.617 mln.
-0.46%
1 janv. 1998
1.441 mds
+11.779 mln.
0.82%
1 janv. 1999
1.472 mds
+31.218 mln.
2.17%
1 janv. 2000
2.096 mds
+623.826 mln.
42.39%
1 janv. 2001
1.985 mds
-110.839 mln.
-5.29%
1 janv. 2002
1.635 mds
-349.66 mln.
-17.62%
1 janv. 2003
2.818 mds
+1.183 mds
72.34%
1 janv. 2004
2.852 mds
+33.662 mln.
1.19%
1 janv. 2005
3.298 mds
+446.821 mln.
15.67%
1 janv. 2006
3.567 mds
+268.246 mln.
8.13%
1 janv. 2007
3.407 mds
-159.966 mln.
-4.49%
1 janv. 2008
3.738 mds
+331.775 mln.
9.74%
1 janv. 2009
4.503 mds
+764.455 mln.
20.45%
1 janv. 2010
4.504 mds
+1.12 mln.
0.02%
1 janv. 2011
4.693 mds
+189.377 mln.
4.2%
1 janv. 2012
7.21 mds
+2.517 mds
53.62%
1 janv. 2013
11.403 mds
+4.193 mds
58.15%
1 janv. 2014
13.457 mds
+2.054 mds
18.02%
1 janv. 2015
14.377 mds
+919.92 mln.
6.84%
1 janv. 2016
10.07 mds
-4.307 mds
-29.96%
Classement des pays selon les statistiques actuelles par années


Commentaires: