29
/fr/
fr
AIzaSyAYiBZKx7MnpbEhh9jyipgxe19OcubqV5w
April 1, 2024
117010
Cyprus
CYP
true
2
1
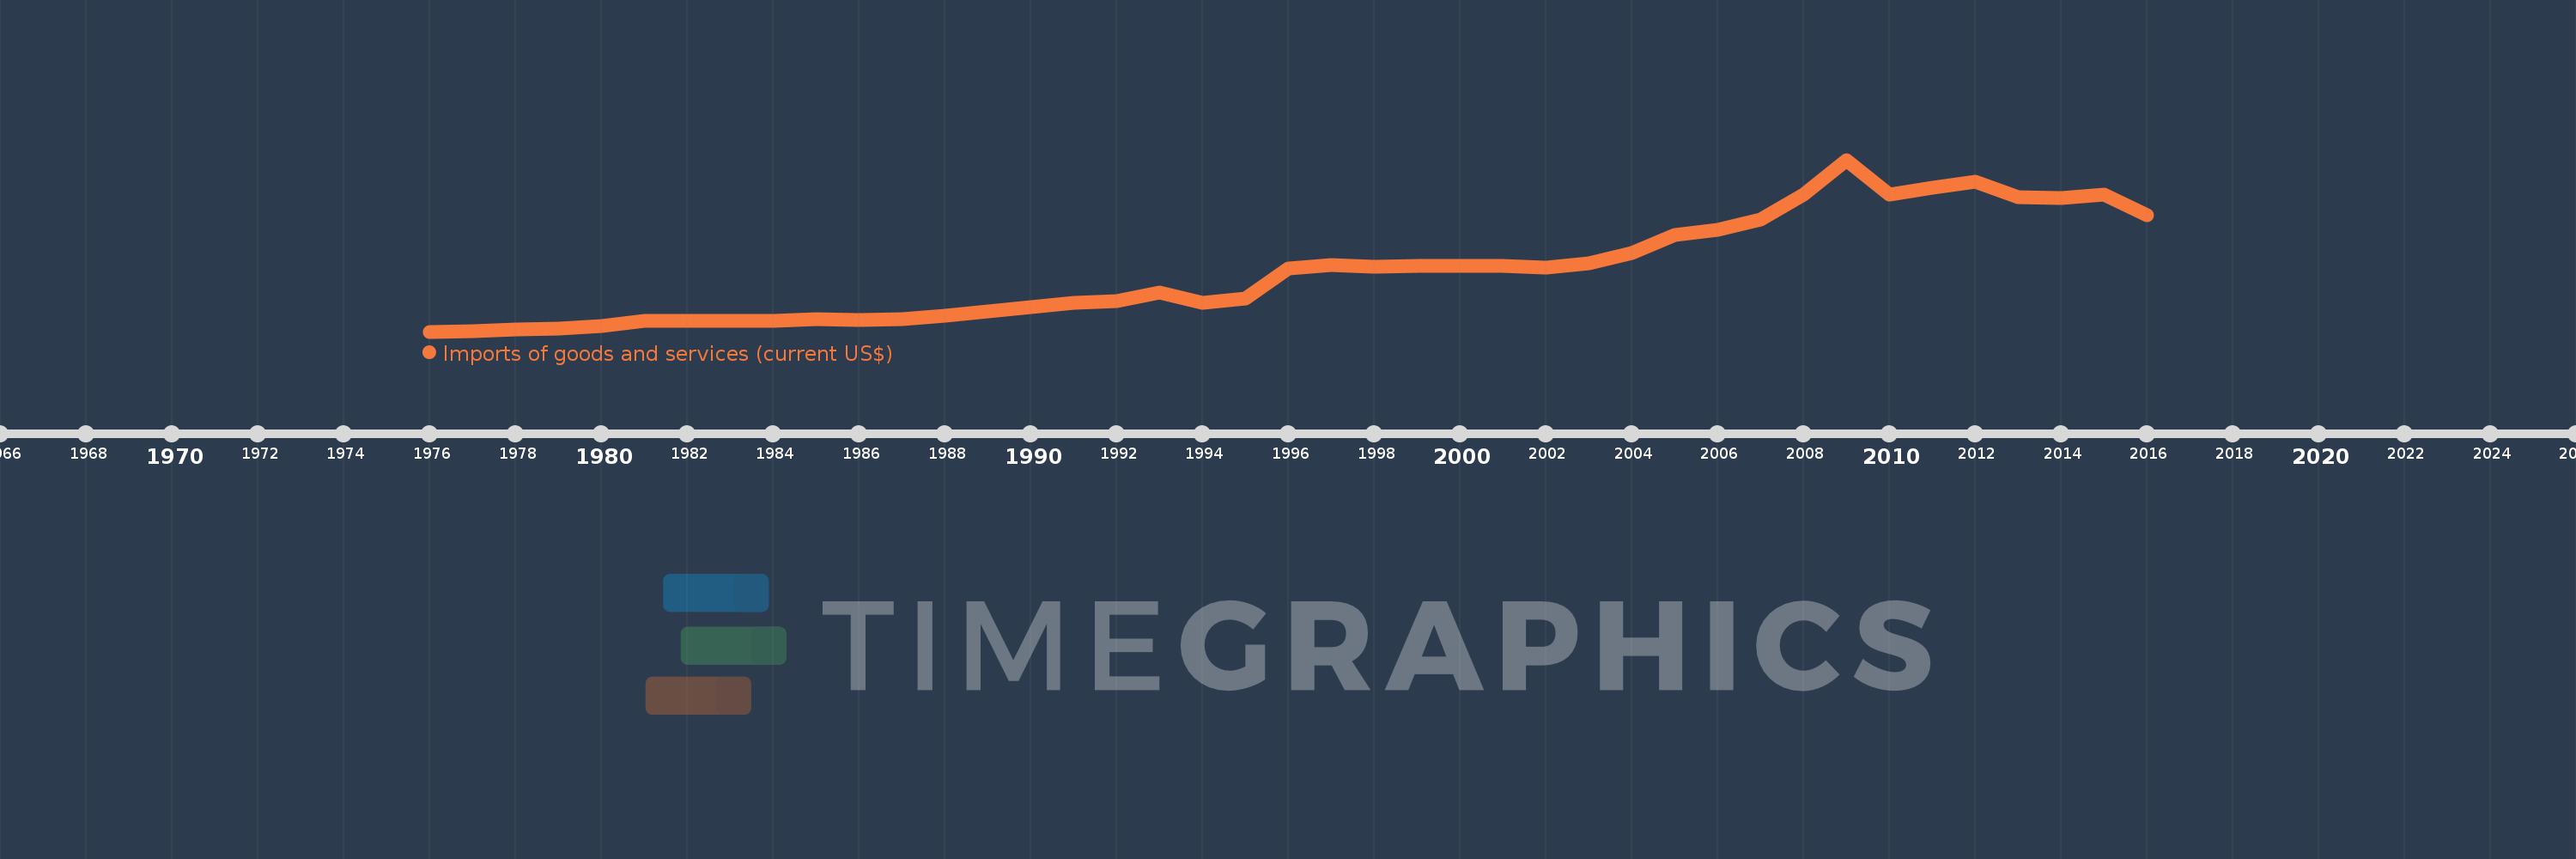
Imports of goods and services (current US$)
2016,2015,2014,2013,2012,2011,2010,2009,2008,2007,2006,2005,2004,2003,2002,2001,2000,1999,1998,1997,1996,1995,1994,1993,1992,1991,1990,1989,1988,1987,1986,1985,1984,1983,1982,1981,1980,1979,1978,1977,1976
Cette statistique dans les autres pays:
AfghanistanAlbaniaAlgeriaAngolaAntigua and BarbudaArab WorldArgentinaArmeniaArubaAustraliaAustriaAzerbaijanBahamas, TheBahrainBangladeshBarbadosBelarusBelgiumBelizeBeninBermudaBhutanBoliviaBosnia and HerzegovinaBotswanaBrazilBrunei DarussalamBulgariaBurkina FasoBurundiCabo VerdeCambodiaCameroonCanadaCaribbean small statesCentral African RepublicCentral Europe and the BalticsChadChileChinaColombiaComorosCongo, Dem. Rep.Congo, Rep.Costa RicaCote d'IvoireCroatiaCubaCyprusCzech RepublicDenmarkDjiboutiDominicaDominican RepublicEarly-demographic dividendEast Asia & PacificEast Asia & Pacific (excluding high income)East Asia & Pacific (IDA & IBRD countries)EcuadorEgypt, Arab Rep.El SalvadorEquatorial GuineaEritreaEstoniaEthiopiaEuro areaEurope & Central AsiaEurope & Central Asia (excluding high income)Europe & Central Asia (IDA & IBRD countries)European UnionFaroe IslandsFijiFinlandFragile and conflict affected situationsFranceFrench PolynesiaGabonGambia, TheGeorgiaGermanyGhanaGreeceGrenadaGuatemalaGuineaGuinea-BissauGuyanaHaitiHeavily indebted poor countries (HIPC)High incomeHondurasHong Kong SAR, ChinaHungaryIBRD onlyIcelandIDA & IBRD totalIDA blendIDA onlyIDA totalIndiaIndonesiaIran, Islamic Rep.IraqIrelandIsraelItalyJamaicaJapanJordanKazakhstanKenyaKiribatiKorea, Rep.KosovoKuwaitKyrgyz RepublicLao PDRLate-demographic dividendLatin America & Caribbean Latin America & Caribbean (excluding high income)Latin America & the Caribbean (IDA & IBRD countries)LatviaLeast developed countries: UN classificationLebanonLesothoLiberiaLibyaLithuaniaLow & middle incomeLow incomeLower middle incomeLuxembourgMacao SAR, ChinaMacedonia, FYRMadagascarMalawiMalaysiaMaldivesMaliMaltaMauritaniaMauritiusMexicoMicronesia, Fed. Sts.Middle East & North AfricaMiddle East & North Africa (excluding high income)Middle East & North Africa (IDA & IBRD countries)Middle incomeMoldovaMongoliaMontenegroMoroccoMozambiqueMyanmarNamibiaNepalNetherlandsNew CaledoniaNew ZealandNicaraguaNigerNigeriaNorth AmericaNorwayOECD membersOmanOther small statesPacific island small statesPakistanPalauPanamaPapua New GuineaParaguayPeruPhilippinesPolandPortugalPost-demographic dividendPre-demographic dividendPuerto RicoQatarRomaniaRussian FederationRwandaSamoaSaudi ArabiaSenegalSerbiaSeychellesSierra LeoneSingaporeSlovak RepublicSloveniaSmall statesSolomon IslandsSomaliaSouth AfricaSouth AsiaSouth Asia (IDA & IBRD)South SudanSpainSri LankaSt. Kitts and NevisSt. LuciaSt. Vincent and the GrenadinesSub-Saharan Africa Sub-Saharan Africa (excluding high income)Sub-Saharan Africa (IDA & IBRD countries)SudanSurinameSwazilandSwedenSwitzerlandSyrian Arab RepublicTajikistanTanzaniaThailandTimor-LesteTogoTongaTrinidad and TobagoTunisiaTurkeyTurkmenistanUgandaUkraineUnited Arab EmiratesUnited KingdomUnited StatesUpper middle incomeUruguayUzbekistanVanuatuVenezuela, RBVietnamWest Bank and GazaWorldYemen, Rep.ZambiaZimbabwe La ligne de temps
Cette échelle de temps montre un graphique de 1976 année à 2016 année Cyprus. Les données jusqu'à 1975 année ne sont pas présentés. Quantité d'observations actuelles selon dates: 41.
Source (désignation):
Les indicateurs du développement mondiale
Source (organisation):
World Bank national accounts data, and OECD National Accounts data files.
Catégories:
Economy & Growth, Trade
Dernière mise à jour
23 avr. 2017
Les indicateurs de changement de valeurs selon les années
Minimum:
277.745 mln.
1 janv. 1976
Maximum:
17.499 mds
1 janv. 2009
Pour la date d''observation
Valeur
Changement absolu
Le changement par rapport à la valeur précédente
1 janv. 1976
277.745 mln.
+277.745 mln.
0.0%
1 janv. 1977
360.768 mln.
+83.023 mln.
29.89%
1 janv. 1978
497.973 mln.
+137.205 mln.
38.03%
1 janv. 1979
606.585 mln.
+108.612 mln.
21.81%
1 janv. 1980
821.766 mln.
+215.181 mln.
35.47%
1 janv. 1981
1.359 mds
+536.898 mln.
65.33%
1 janv. 1982
1.322 mds
-36.821 mln.
-2.71%
1 janv. 1983
1.387 mds
+65.263 mln.
4.94%
1 janv. 1984
1.382 mds
-5.021 mln.
-0.36%
1 janv. 1985
1.529 mds
+146.627 mln.
10.61%
1 janv. 1986
1.43 mds
-98.866 mln.
-6.47%
1 janv. 1987
1.497 mds
+66.772 mln.
4.67%
1 janv. 1988
1.862 mds
+365.777 mln.
24.44%
1 janv. 1989
2.289 mds
+426.958 mln.
22.93%
1 janv. 1990
2.732 mds
+442.992 mln.
19.35%
1 janv. 1991
3.193 mds
+460.616 mln.
16.86%
1 janv. 1992
3.294 mds
+101.488 mln.
3.18%
1 janv. 1993
4.192 mds
+897.08 mln.
27.23%
1 janv. 1994
3.158 mds
-1.033 mds
-24.65%
1 janv. 1995
3.571 mds
+412.377 mln.
13.06%
1 janv. 1996
6.645 mds
+3.075 mds
86.11%
1 janv. 1997
6.993 mds
+347.943 mln.
5.24%
1 janv. 1998
6.771 mds
-221.856 mln.
-3.17%
1 janv. 1999
6.855 mds
+83.823 mln.
1.24%
1 janv. 2000
6.823 mds
-31.908 mln.
-0.47%
1 janv. 2001
6.877 mds
+53.688 mln.
0.79%
1 janv. 2002
6.725 mds
-152.052 mln.
-2.21%
1 janv. 2003
7.115 mds
+389.474 mln.
5.79%
1 janv. 2004
8.198 mds
+1.084 mds
15.23%
1 janv. 2005
9.933 mds
+1.735 mds
21.16%
1 janv. 2006
10.516 mds
+582.606 mln.
5.87%
1 janv. 2007
11.502 mds
+985.837 mln.
9.37%
1 janv. 2008
13.969 mds
+2.467 mds
21.45%
1 janv. 2009
17.499 mds
+3.53 mds
25.27%
1 janv. 2010
14.028 mds
-3.47 mds
-19.83%
1 janv. 2011
14.693 mds
+664.374 mln.
4.74%
1 janv. 2012
15.321 mds
+628.386 mln.
4.28%
1 janv. 2013
13.754 mds
-1.567 mds
-10.23%
1 janv. 2014
13.686 mds
-68.073 mln.
-0.49%
1 janv. 2015
14.017 mds
+331.375 mln.
2.42%
1 janv. 2016
11.909 mds
-2.109 mds
-15.04%
Classement des pays selon les statistiques actuelles par années


Commentaires: