29
/fr/
fr
AIzaSyAYiBZKx7MnpbEhh9jyipgxe19OcubqV5w
April 1, 2024
199193
Mongolia
MNG
true
2
1
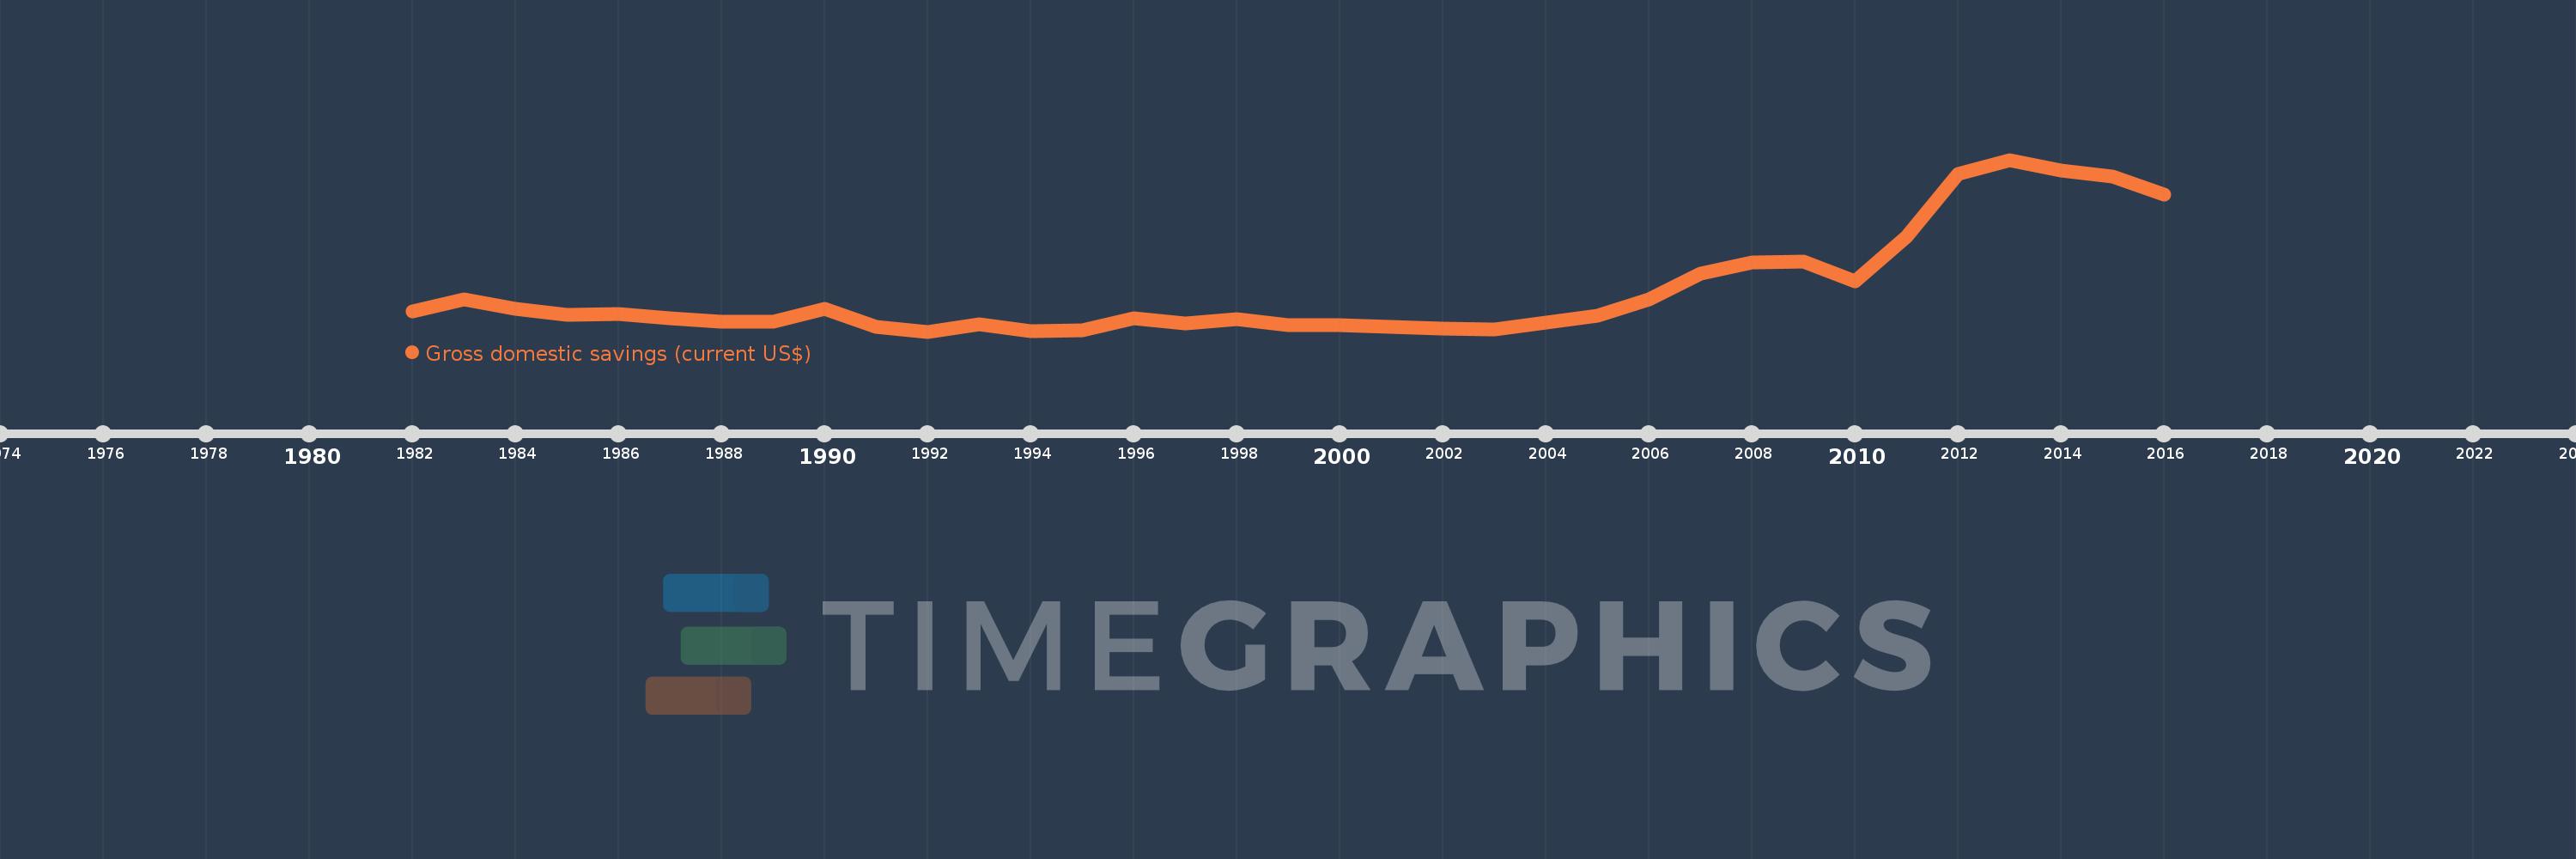
Gross domestic savings (current US$)
2016,2015,2014,2013,2012,2011,2010,2009,2008,2007,2006,2005,2004,2003,2002,2001,2000,1999,1998,1997,1996,1995,1994,1993,1992,1991,1990,1989,1988,1987,1986,1985,1984,1983,1982
Cette statistique dans les autres pays:
AfghanistanAlbaniaAlgeriaAngolaAntigua and BarbudaArab WorldArgentinaArmeniaArubaAustraliaAustriaAzerbaijanBahamas, TheBahrainBangladeshBarbadosBelarusBelgiumBelizeBeninBermudaBhutanBoliviaBosnia and HerzegovinaBotswanaBrazilBrunei DarussalamBulgariaBurkina FasoBurundiCabo VerdeCambodiaCameroonCanadaCaribbean small statesCentral African RepublicCentral Europe and the BalticsChadChileChinaColombiaComorosCongo, Dem. Rep.Congo, Rep.Costa RicaCote d'IvoireCroatiaCubaCyprusCzech RepublicDenmarkDjiboutiDominicaDominican RepublicEarly-demographic dividendEast Asia & PacificEast Asia & Pacific (excluding high income)East Asia & Pacific (IDA & IBRD countries)EcuadorEgypt, Arab Rep.El SalvadorEquatorial GuineaEritreaEstoniaEthiopiaEuro areaEurope & Central AsiaEurope & Central Asia (excluding high income)Europe & Central Asia (IDA & IBRD countries)European UnionFaroe IslandsFijiFinlandFragile and conflict affected situationsFranceGabonGambia, TheGeorgiaGermanyGhanaGreeceGrenadaGuatemalaGuineaGuinea-BissauGuyanaHaitiHeavily indebted poor countries (HIPC)High incomeHondurasHong Kong SAR, ChinaHungaryIBRD onlyIcelandIDA & IBRD totalIDA blendIDA onlyIDA totalIndiaIndonesiaIran, Islamic Rep.IraqIrelandIsraelItalyJamaicaJapanJordanKazakhstanKenyaKiribatiKorea, Rep.KosovoKuwaitKyrgyz RepublicLao PDRLate-demographic dividendLatin America & Caribbean Latin America & Caribbean (excluding high income)Latin America & the Caribbean (IDA & IBRD countries)LatviaLeast developed countries: UN classificationLebanonLesothoLiberiaLibyaLithuaniaLow & middle incomeLow incomeLower middle incomeLuxembourgMacao SAR, ChinaMacedonia, FYRMadagascarMalawiMalaysiaMaldivesMaliMaltaMauritaniaMauritiusMexicoMicronesia, Fed. Sts.Middle East & North AfricaMiddle East & North Africa (excluding high income)Middle East & North Africa (IDA & IBRD countries)Middle incomeMoldovaMongoliaMontenegroMoroccoMozambiqueNamibiaNepalNetherlandsNew CaledoniaNew ZealandNicaraguaNigerNigeriaNorth AmericaNorwayOECD membersOmanOther small statesPakistanPanamaPapua New GuineaParaguayPeruPhilippinesPolandPortugalPost-demographic dividendPre-demographic dividendPuerto RicoQatarRomaniaRussian FederationRwandaSaudi ArabiaSenegalSerbiaSeychellesSierra LeoneSingaporeSlovak RepublicSloveniaSmall statesSolomon IslandsSouth AfricaSouth AsiaSouth Asia (IDA & IBRD)South SudanSpainSri LankaSt. Kitts and NevisSt. LuciaSt. Vincent and the GrenadinesSub-Saharan Africa Sub-Saharan Africa (excluding high income)Sub-Saharan Africa (IDA & IBRD countries)SudanSurinameSwazilandSwedenSwitzerlandSyrian Arab RepublicTajikistanTanzaniaThailandTimor-LesteTogoTongaTrinidad and TobagoTunisiaTurkeyTurkmenistanUgandaUkraineUnited Arab EmiratesUnited KingdomUnited StatesUpper middle incomeUruguayUzbekistanVanuatuVenezuela, RBVietnamWest Bank and GazaWorldYemen, Rep.ZambiaZimbabwe La ligne de temps
Cette échelle de temps montre un graphique de 1982 année à 2016 année Mongolia. Les données jusqu'à 1981 année ne sont pas présentés. Quantité d'observations actuelles selon dates: 35.
Source (désignation):
Les indicateurs du développement mondiale
Source (organisation):
World Bank national accounts data, and OECD National Accounts data files.
Catégories:
Economy & Growth
Dernière mise à jour
23 avr. 2017
Les indicateurs de changement de valeurs selon les années
Minimum:
59.416 mln.
1 janv. 1992
Maximum:
4.112 mds
1 janv. 2013
Pour la date d''observation
Valeur
Changement absolu
Le changement par rapport à la valeur précédente
1 janv. 1982
526.541 mln.
+526.541 mln.
0.0%
1 janv. 1983
817.548 mln.
+291.007 mln.
55.27%
1 janv. 1984
604.915 mln.
-212.633 mln.
-26.01%
1 janv. 1985
459.797 mln.
-145.117 mln.
-23.99%
1 janv. 1986
466.057 mln.
+6.26 mln.
1.36%
1 janv. 1987
366.012 mln.
-100.045 mln.
-21.47%
1 janv. 1988
283.106 mln.
-82.906 mln.
-22.65%
1 janv. 1989
295.748 mln.
+12.642 mln.
4.47%
1 janv. 1990
586.998 mln.
+291.25 mln.
98.48%
1 janv. 1991
179.123 mln.
-407.875 mln.
-69.48%
1 janv. 1992
59.416 mln.
-119.707 mln.
-66.83%
1 janv. 1993
240.138 mln.
+180.722 mln.
304.16%
1 janv. 1994
76.75 mln.
-163.387 mln.
-68.04%
1 janv. 1995
84.904 mln.
+8.154 mln.
10.62%
1 janv. 1996
374.137 mln.
+289.233 mln.
340.66%
1 janv. 1997
259.396 mln.
-114.741 mln.
-30.67%
1 janv. 1998
358.72 mln.
+99.324 mln.
38.29%
1 janv. 1999
211.41 mln.
-147.31 mln.
-41.07%
1 janv. 2000
208.983 mln.
-2.427 mln.
-1.15%
1 janv. 2001
171.872 mln.
-37.111 mln.
-17.76%
1 janv. 2002
126.702 mln.
-45.17 mln.
-26.28%
1 janv. 2003
105.827 mln.
-20.876 mln.
-16.48%
1 janv. 2004
265.896 mln.
+160.069 mln.
151.26%
1 janv. 2005
426.888 mln.
+160.992 mln.
60.55%
1 janv. 2006
824.819 mln.
+397.931 mln.
93.22%
1 janv. 2007
1.429 mds
+603.682 mln.
73.19%
1 janv. 2008
1.696 mds
+267.77 mln.
18.74%
1 janv. 2009
1.71 mds
+13.311 mln.
0.78%
1 janv. 2010
1.243 mds
-466.754 mln.
-27.3%
1 janv. 2011
2.307 mds
+1.065 mds
85.66%
1 janv. 2012
3.774 mds
+1.467 mds
63.58%
1 janv. 2013
4.112 mds
+338.02 mln.
8.96%
1 janv. 2014
3.868 mds
-244.195 mln.
-5.94%
1 janv. 2015
3.711 mds
-157.405 mln.
-4.07%
1 janv. 2016
3.29 mds
-420.888 mln.
-11.34%
Classement des pays selon les statistiques actuelles par années


Commentaires: