29
/fr/
fr
AIzaSyAYiBZKx7MnpbEhh9jyipgxe19OcubqV5w
April 1, 2024
127394
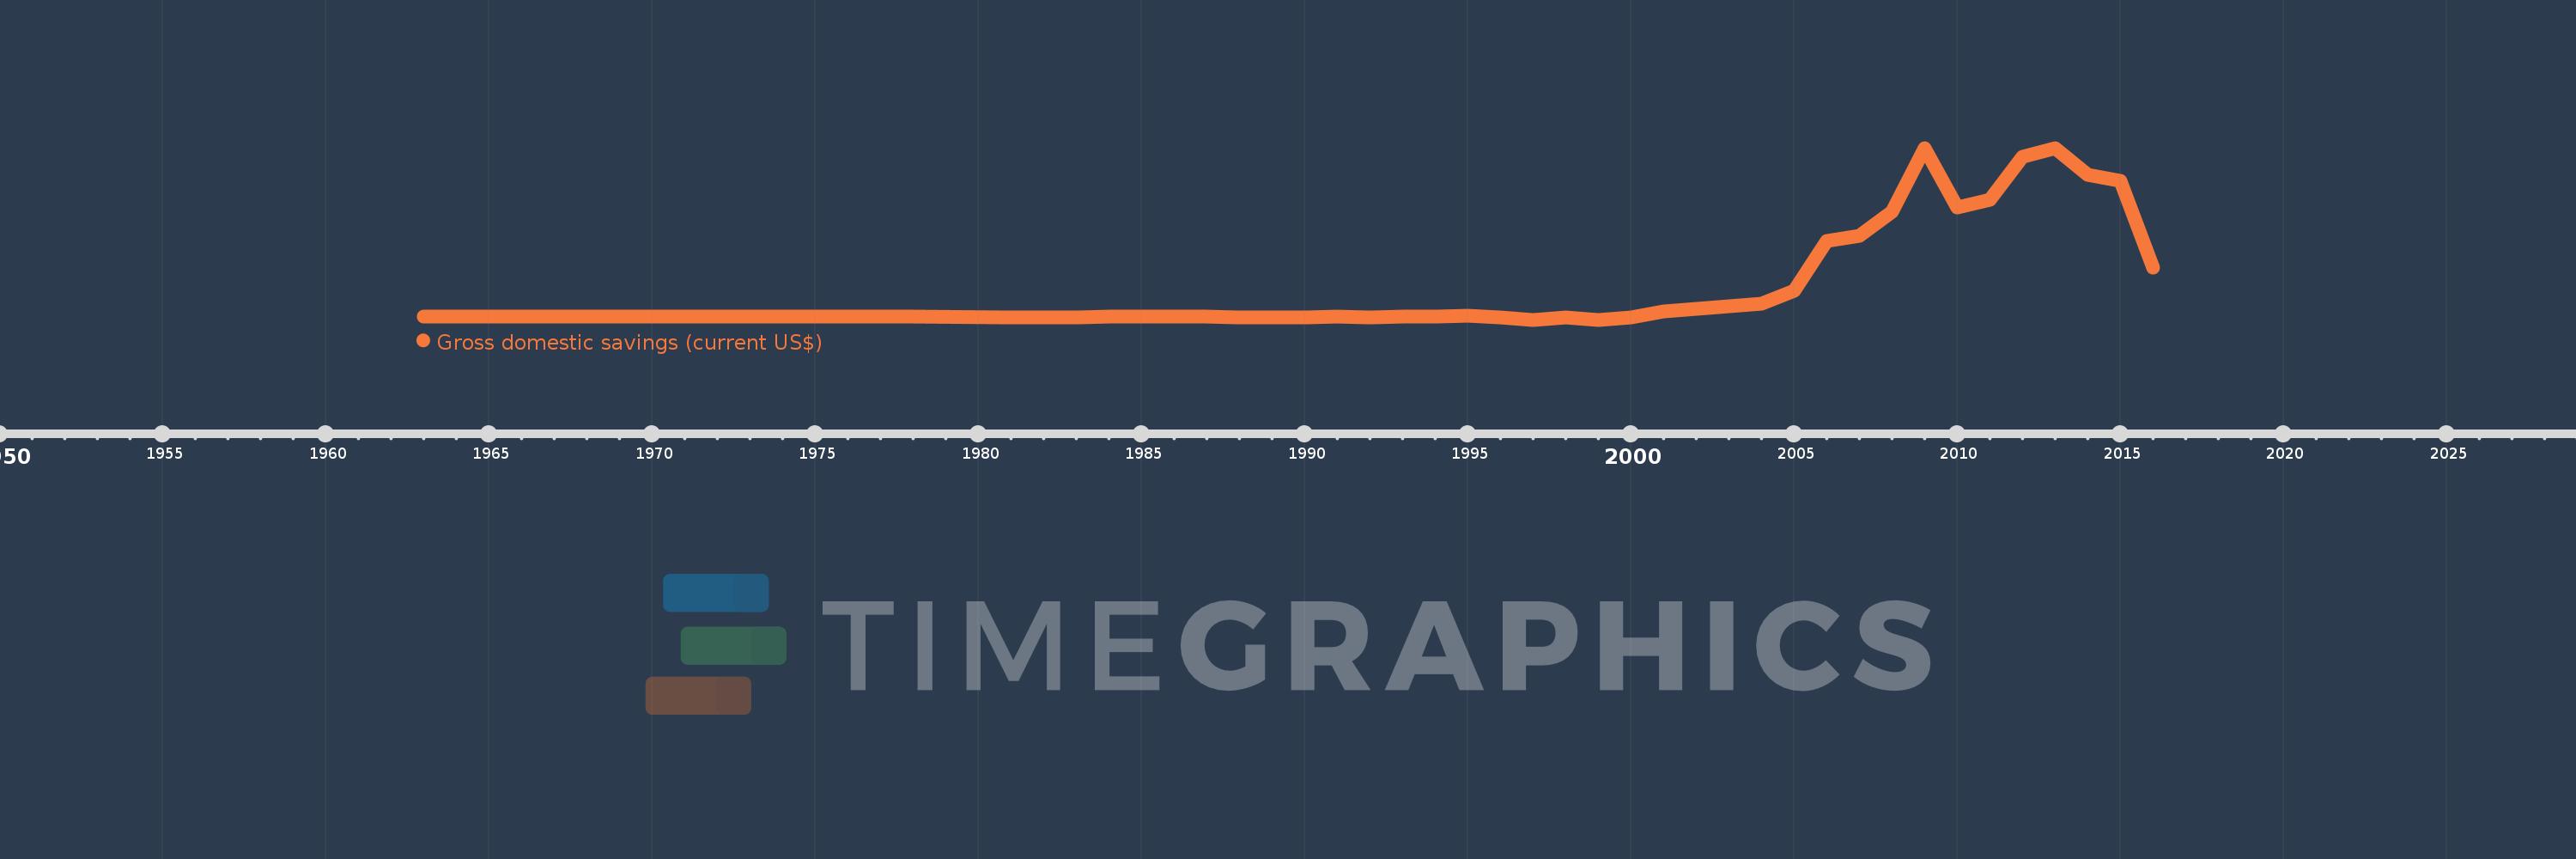
Equatorial Guinea
GNQ
true
2
1
Gross domestic savings (current US$)
2016,2015,2014,2013,2012,2011,2010,2009,2008,2007,2006,2005,2004,2003,2002,2001,2000,1999,1998,1997,1996,1995,1994,1993,1992,1991,1990,1989,1988,1987,1986,1985,1984,1983,1982,1981,1978,1977,1976,1975,1974,1973,1972,1971,1970,1969,1968,1967,1966,1965,1964,1963
Cette statistique dans les autres pays:
AfghanistanAlbaniaAlgeriaAngolaAntigua and BarbudaArab WorldArgentinaArmeniaArubaAustraliaAustriaAzerbaijanBahamas, TheBahrainBangladeshBarbadosBelarusBelgiumBelizeBeninBermudaBhutanBoliviaBosnia and HerzegovinaBotswanaBrazilBrunei DarussalamBulgariaBurkina FasoBurundiCabo VerdeCambodiaCameroonCanadaCaribbean small statesCentral African RepublicCentral Europe and the BalticsChadChileChinaColombiaComorosCongo, Dem. Rep.Congo, Rep.Costa RicaCote d'IvoireCroatiaCubaCyprusCzech RepublicDenmarkDjiboutiDominicaDominican RepublicEarly-demographic dividendEast Asia & PacificEast Asia & Pacific (excluding high income)East Asia & Pacific (IDA & IBRD countries)EcuadorEgypt, Arab Rep.El SalvadorEquatorial GuineaEritreaEstoniaEthiopiaEuro areaEurope & Central AsiaEurope & Central Asia (excluding high income)Europe & Central Asia (IDA & IBRD countries)European UnionFaroe IslandsFijiFinlandFragile and conflict affected situationsFranceGabonGambia, TheGeorgiaGermanyGhanaGreeceGrenadaGuatemalaGuineaGuinea-BissauGuyanaHaitiHeavily indebted poor countries (HIPC)High incomeHondurasHong Kong SAR, ChinaHungaryIBRD onlyIcelandIDA & IBRD totalIDA blendIDA onlyIDA totalIndiaIndonesiaIran, Islamic Rep.IraqIrelandIsraelItalyJamaicaJapanJordanKazakhstanKenyaKiribatiKorea, Rep.KosovoKuwaitKyrgyz RepublicLao PDRLate-demographic dividendLatin America & Caribbean Latin America & Caribbean (excluding high income)Latin America & the Caribbean (IDA & IBRD countries)LatviaLeast developed countries: UN classificationLebanonLesothoLiberiaLibyaLithuaniaLow & middle incomeLow incomeLower middle incomeLuxembourgMacao SAR, ChinaMacedonia, FYRMadagascarMalawiMalaysiaMaldivesMaliMaltaMauritaniaMauritiusMexicoMicronesia, Fed. Sts.Middle East & North AfricaMiddle East & North Africa (excluding high income)Middle East & North Africa (IDA & IBRD countries)Middle incomeMoldovaMongoliaMontenegroMoroccoMozambiqueNamibiaNepalNetherlandsNew CaledoniaNew ZealandNicaraguaNigerNigeriaNorth AmericaNorwayOECD membersOmanOther small statesPakistanPanamaPapua New GuineaParaguayPeruPhilippinesPolandPortugalPost-demographic dividendPre-demographic dividendPuerto RicoQatarRomaniaRussian FederationRwandaSaudi ArabiaSenegalSerbiaSeychellesSierra LeoneSingaporeSlovak RepublicSloveniaSmall statesSolomon IslandsSouth AfricaSouth AsiaSouth Asia (IDA & IBRD)South SudanSpainSri LankaSt. Kitts and NevisSt. LuciaSt. Vincent and the GrenadinesSub-Saharan Africa Sub-Saharan Africa (excluding high income)Sub-Saharan Africa (IDA & IBRD countries)SudanSurinameSwazilandSwedenSwitzerlandSyrian Arab RepublicTajikistanTanzaniaThailandTimor-LesteTogoTongaTrinidad and TobagoTunisiaTurkeyTurkmenistanUgandaUkraineUnited Arab EmiratesUnited KingdomUnited StatesUpper middle incomeUruguayUzbekistanVanuatuVenezuela, RBVietnamWest Bank and GazaWorldYemen, Rep.ZambiaZimbabwe La ligne de temps
Cette échelle de temps montre un graphique de 1963 année à 2016 année Equatorial Guinea. Les données jusqu'à 1962 année ne sont pas présentés. Quantité d'observations actuelles selon dates: 52.
Source (désignation):
Les indicateurs du développement mondiale
Source (organisation):
World Bank national accounts data, and OECD National Accounts data files.
Catégories:
Economy & Growth
Dernière mise à jour
23 avr. 2017
Les indicateurs de changement de valeurs selon les années
Minimum:
-299.726 mln.
1 janv. 1999
Maximum:
15.288 mds
1 janv. 2013
Pour la date d''observation
Valeur
Changement absolu
Le changement par rapport à la valeur précédente
1 janv. 1963
3.037 mln.
+3.037 mln.
0.0%
1 janv. 1964
4.951 mln.
+1.914 mln.
63.04%
1 janv. 1965
5.477 mln.
+526.255 milles
10.63%
1 janv. 1966
17.933 mln.
+12.456 mln.
227.43%
1 janv. 1967
21.65 mln.
+3.717 mln.
20.72%
1 janv. 1968
21.794 mln.
+144.477 milles
0.67%
1 janv. 1969
23.786 mln.
+1.991 mln.
9.14%
1 janv. 1970
15.186 mln.
-8.6 mln.
-36.16%
1 janv. 1971
6.956 mln.
-8.23 mln.
-54.2%
1 janv. 1972
11.278 mln.
+4.323 mln.
62.15%
1 janv. 1973
7.356 mln.
-3.922 mln.
-34.77%
1 janv. 1974
2.295 mln.
-5.061 mln.
-68.8%
1 janv. 1975
123.078 milles
-2.172 mln.
-94.64%
1 janv. 1976
7.457 mln.
+7.334 mln.
5.96 milles%
1 janv. 1977
7.964 mln.
+506.49 milles
6.79%
1 janv. 1978
8.138 mln.
+174.511 milles
2.19%
1 janv. 1981
-80.945 mln.
-89.083 mln.
-1.09 milles%
1 janv. 1982
-88.837 mln.
-7.892 mln.
9.75%
1 janv. 1983
-55.998 mln.
+32.839 mln.
-36.97%
1 janv. 1984
-8.065 mln.
+47.933 mln.
-85.6%
1 janv. 1985
-32.55 mln.
-24.485 mln.
303.59%
1 janv. 1986
-9.02 mln.
+23.53 mln.
-72.29%
1 janv. 1987
-32.236 mln.
-23.216 mln.
257.39%
1 janv. 1988
-66.894 mln.
-34.658 mln.
107.51%
1 janv. 1989
-87.868 mln.
-20.974 mln.
31.35%
1 janv. 1990
-50.779 mln.
+37.089 mln.
-42.21%
1 janv. 1991
-8.412 mln.
+42.367 mln.
-83.43%
1 janv. 1992
-70.746 mln.
-62.334 mln.
741.0%
1 janv. 1993
-26.925 mln.
+43.821 mln.
-61.94%
1 janv. 1994
-7.008 mln.
+19.917 mln.
-73.97%
1 janv. 1995
51.122 mln.
+58.13 mln.
-829.49%
1 janv. 1996
-84.283 mln.
-135.404 mln.
-264.87%
1 janv. 1997
-292.163 mln.
-207.88 mln.
246.65%
1 janv. 1998
-80.906 mln.
+211.257 mln.
-72.31%
1 janv. 1999
-299.726 mln.
-218.82 mln.
270.46%
1 janv. 2000
-64.391 mln.
+235.335 mln.
-78.52%
1 janv. 2001
429.311 mln.
+493.702 mln.
-766.73%
1 janv. 2002
665.691 mln.
+236.38 mln.
55.06%
1 janv. 2003
886.88 mln.
+221.19 mln.
33.23%
1 janv. 2004
1.166 mds
+278.873 mln.
31.44%
1 janv. 2005
2.304 mds
+1.138 mds
97.65%
1 janv. 2006
6.844 mds
+4.54 mds
197.03%
1 janv. 2007
7.325 mds
+480.797 mln.
7.03%
1 janv. 2008
9.509 mds
+2.184 mds
29.82%
1 janv. 2009
15.267 mds
+5.758 mds
60.56%
1 janv. 2010
9.898 mds
-5.369 mds
-35.17%
1 janv. 2011
10.579 mds
+680.476 mln.
6.87%
1 janv. 2012
14.475 mds
+3.896 mds
36.83%
1 janv. 2013
15.288 mds
+813.57 mln.
5.62%
1 janv. 2014
12.885 mds
-2.403 mds
-15.72%
1 janv. 2015
12.326 mds
-559.111 mln.
-4.34%
1 janv. 2016
4.426 mds
-7.899 mds
-64.09%
Classement des pays selon les statistiques actuelles par années


Commentaires: