29
/fr/
fr
AIzaSyAYiBZKx7MnpbEhh9jyipgxe19OcubqV5w
April 1, 2024
194867
Mauritius
MUS
true
2
1
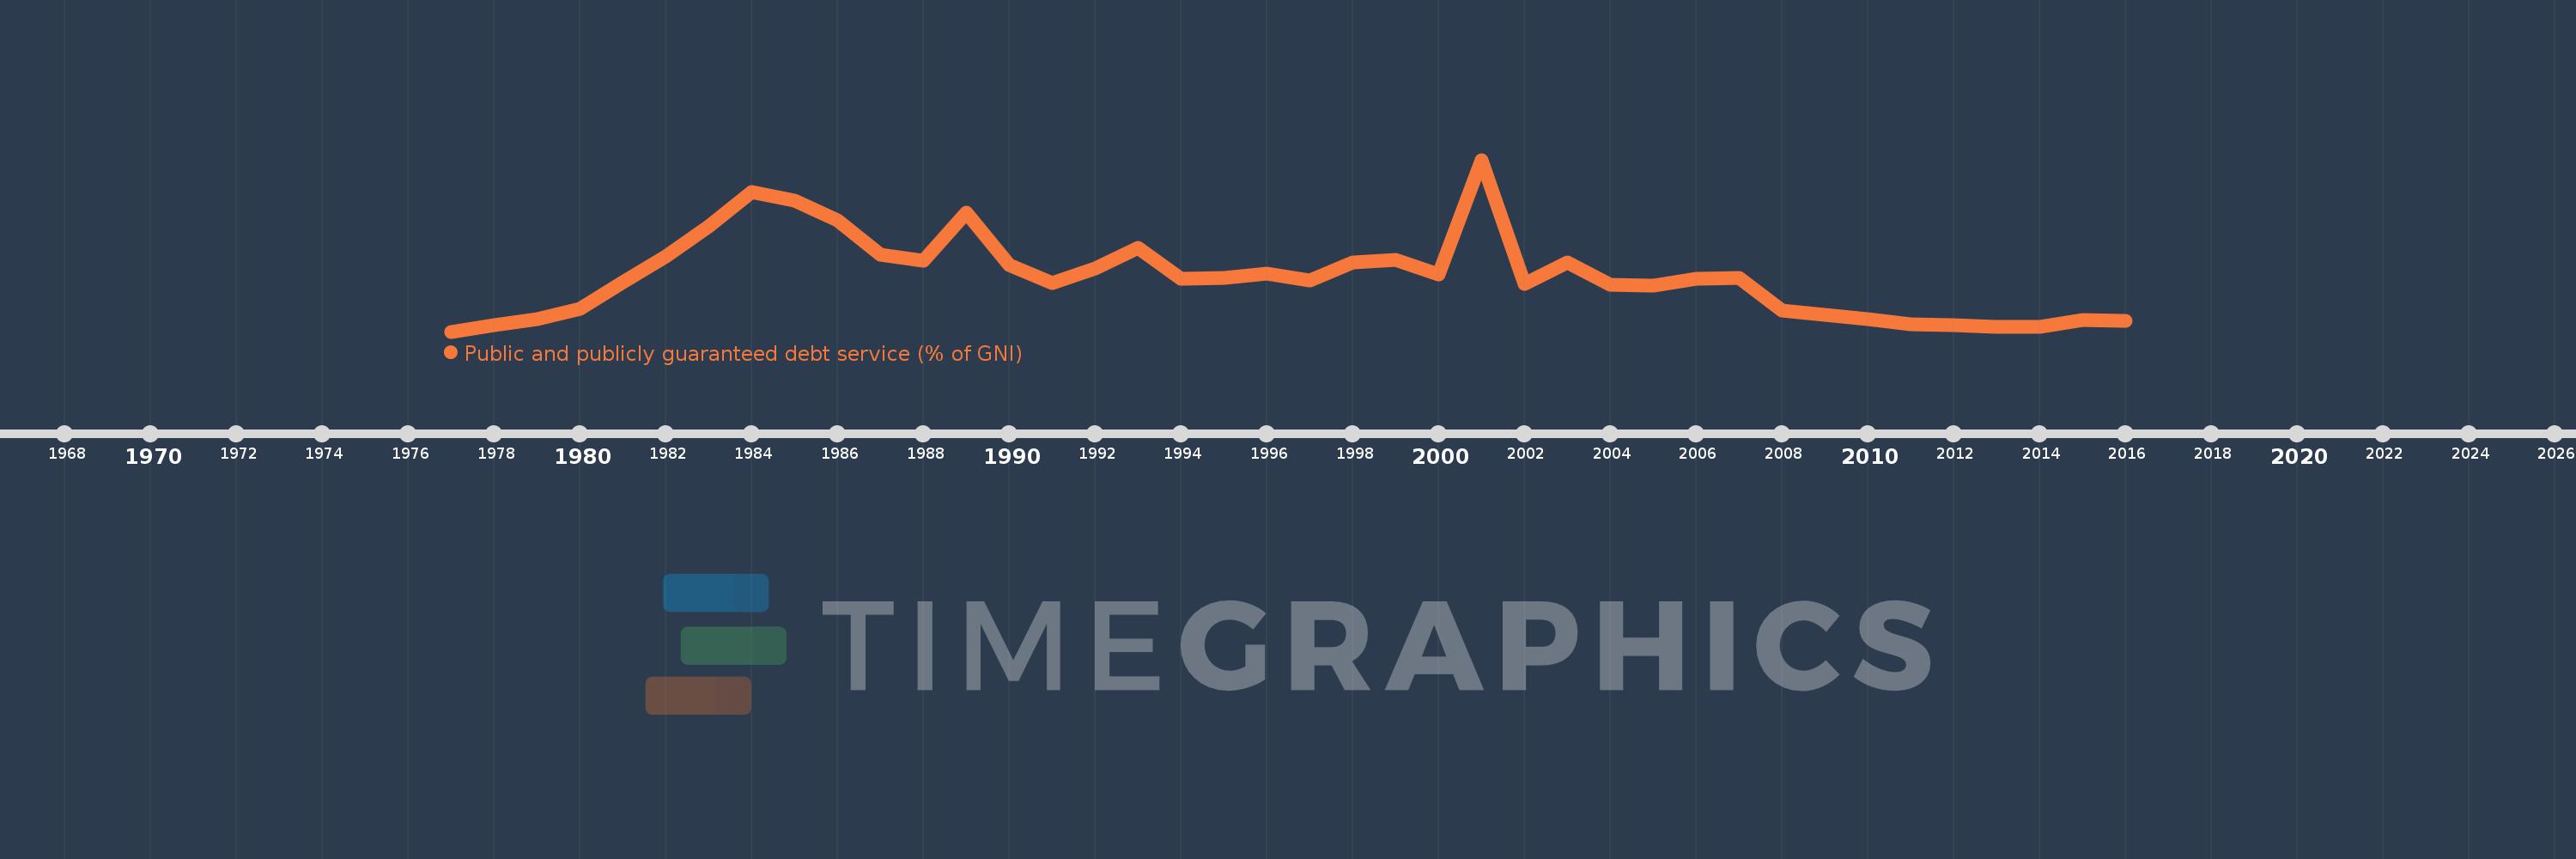
Public and publicly guaranteed debt service (% of GNI)
2016,2015,2014,2013,2012,2011,2010,2009,2008,2007,2006,2005,2004,2003,2002,2001,2000,1999,1998,1997,1996,1995,1994,1993,1992,1991,1990,1989,1988,1987,1986,1985,1984,1983,1982,1981,1980,1979,1978,1977
Cette statistique dans les autres pays:
La ligne de temps
Cette échelle de temps montre un graphique de 1977 année à 2016 année Mauritius. Les données jusqu'à 1976 année ne sont pas présentés. Quantité d'observations actuelles selon dates: 40.
Source (désignation):
Les indicateurs du développement mondiale
Source (organisation):
World Bank, International Debt Statistics.
Catégories:
External Debt
Dernière mise à jour
23 avr. 2017
Les indicateurs de changement de valeurs selon les années
Minimum:
0.474
1 janv. 1977
Maximum:
9.589
1 janv. 2001
Pour la date d''observation
Valeur
Changement absolu
Le changement par rapport à la valeur précédente
1 janv. 1977
0.474
+0.474
0.0%
1 janv. 1978
0.815
+0.341
71.96%
1 janv. 1979
1.137
+0.321
39.44%
1 janv. 1980
1.7
+0.564
49.61%
1 janv. 1981
3.106
+1.405
82.63%
1 janv. 1982
4.469
+1.364
43.91%
1 janv. 1983
6.045
+1.576
35.27%
1 janv. 1984
7.883
+1.838
30.4%
1 janv. 1985
7.445
-0.438
-5.56%
1 janv. 1986
6.375
-1.069
-14.36%
1 janv. 1987
4.562
-1.813
-28.44%
1 janv. 1988
4.241
-0.321
-7.04%
1 janv. 1989
6.792
+2.551
60.15%
1 janv. 1990
4.02
-2.772
-40.82%
1 janv. 1991
3.061
-0.959
-23.86%
1 janv. 1992
3.806
+0.745
24.33%
1 janv. 1993
4.906
+1.101
28.93%
1 janv. 1994
3.283
-1.623
-33.09%
1 janv. 1995
3.31
+0.027
0.82%
1 janv. 1996
3.573
+0.263
7.94%
1 janv. 1997
3.17
-0.403
-11.29%
1 janv. 1998
4.152
+0.982
30.99%
1 janv. 1999
4.279
+0.127
3.06%
1 janv. 2000
3.493
-0.787
-18.38%
1 janv. 2001
9.589
+6.097
174.55%
1 janv. 2002
3.023
-6.566
-68.47%
1 janv. 2003
4.131
+1.108
36.64%
1 janv. 2004
2.954
-1.178
-28.51%
1 janv. 2005
2.898
-0.056
-1.88%
1 janv. 2006
3.271
+0.373
12.87%
1 janv. 2007
3.305
+0.034
1.05%
1 janv. 2008
1.594
-1.712
-51.78%
1 janv. 2009
1.344
-0.249
-15.63%
1 janv. 2010
1.153
-0.192
-14.24%
1 janv. 2011
0.851
-0.302
-26.22%
1 janv. 2012
0.81
-0.041
-4.78%
1 janv. 2013
0.724
-0.086
-10.66%
1 janv. 2014
0.704
-0.02
-2.77%
1 janv. 2015
1.093
+0.39
55.4%
1 janv. 2016
1.023
-0.07
-6.41%
Classement des pays selon les statistiques actuelles par années


Commentaires: