29
/fr/
fr
AIzaSyAYiBZKx7MnpbEhh9jyipgxe19OcubqV5w
April 1, 2024
165478
Jordan
JOR
true
2
1
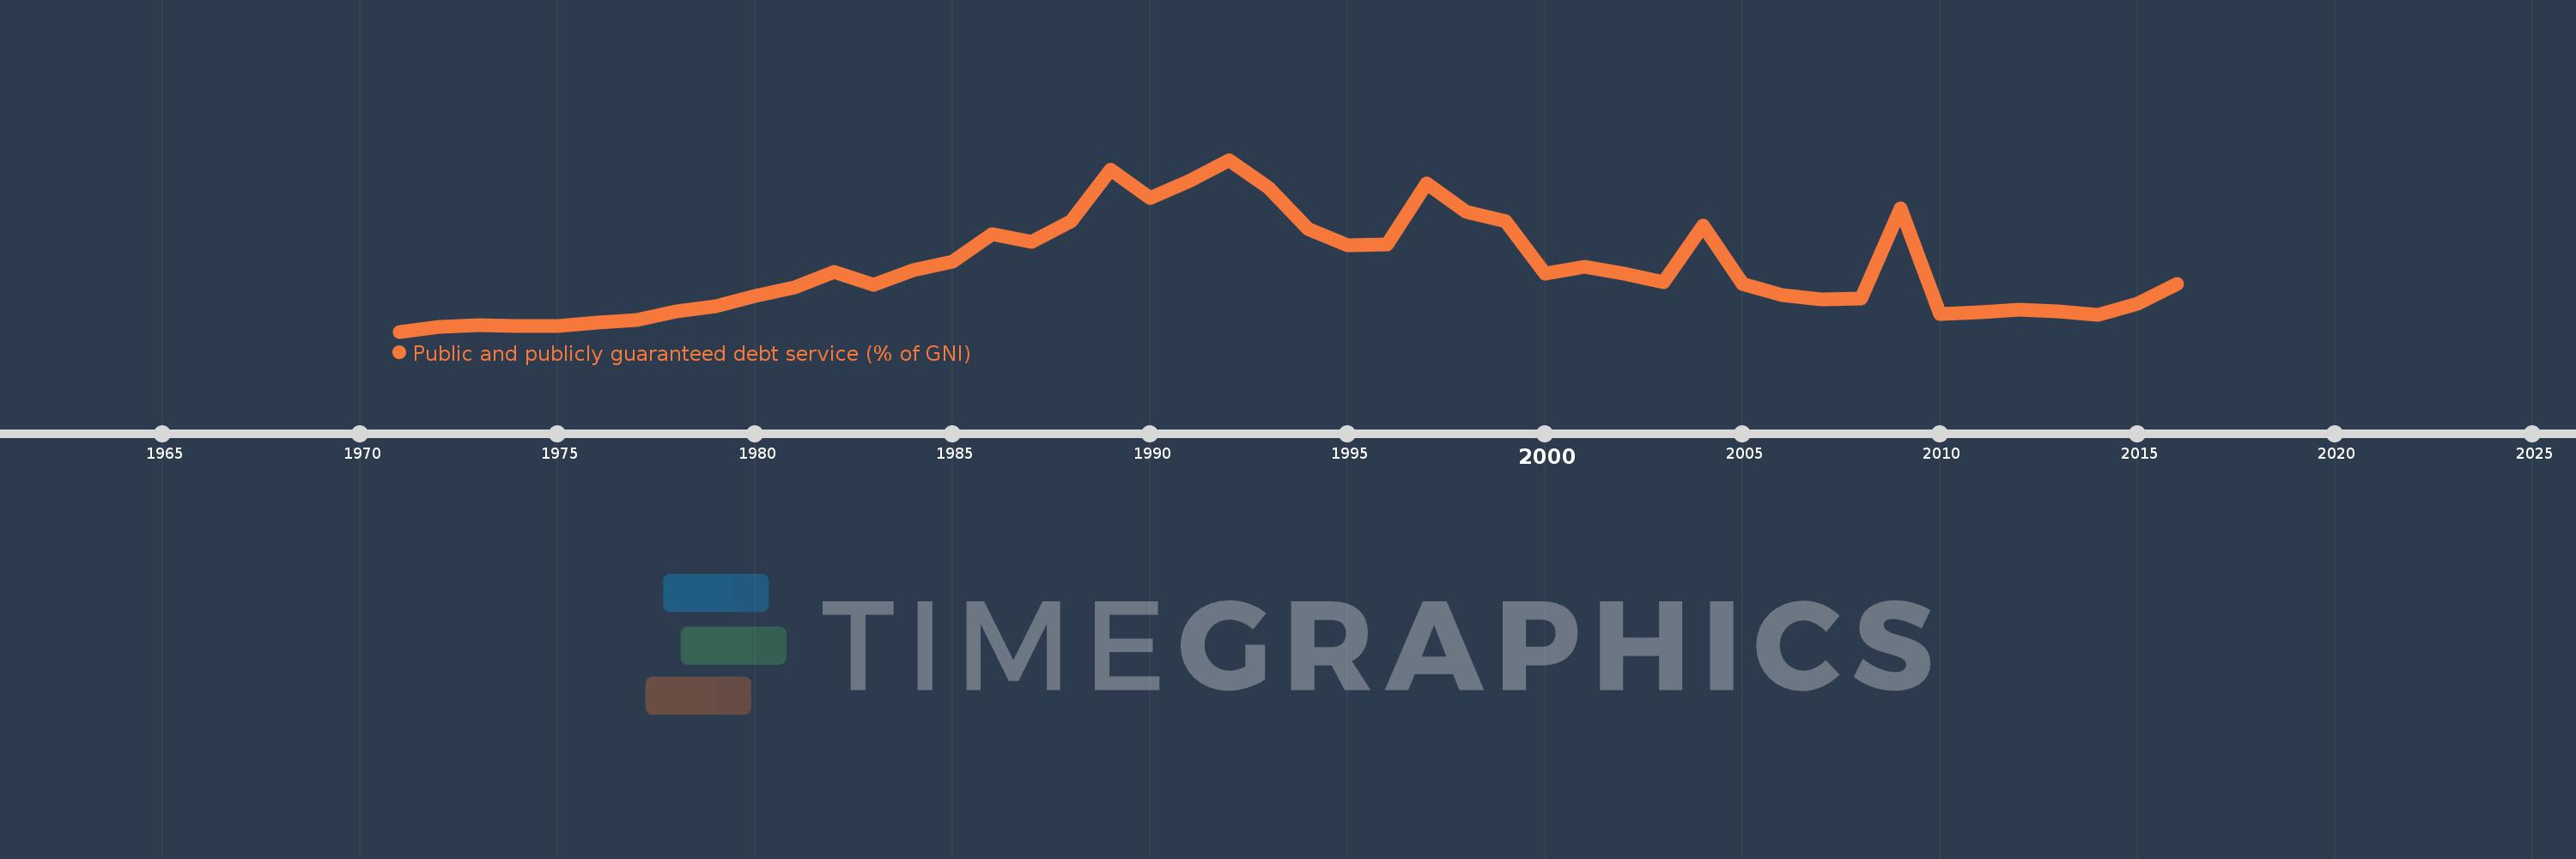
Public and publicly guaranteed debt service (% of GNI)
2016,2015,2014,2013,2012,2011,2010,2009,2008,2007,2006,2005,2004,2003,2002,2001,2000,1999,1998,1997,1996,1995,1994,1993,1992,1991,1990,1989,1988,1987,1986,1985,1984,1983,1982,1981,1980,1979,1978,1977,1976,1975,1974,1973,1972,1971
Cette statistique dans les autres pays:
La ligne de temps
Cette échelle de temps montre un graphique de 1971 année à 2016 année Jordan. Les données jusqu'à 1970 année ne sont pas présentés. Quantité d'observations actuelles selon dates: 46.
Source (désignation):
Les indicateurs du développement mondiale
Source (organisation):
World Bank, International Debt Statistics.
Catégories:
External Debt
Dernière mise à jour
23 avr. 2017
Les indicateurs de changement de valeurs selon les années
Minimum:
0.689
1 janv. 1971
Maximum:
15.833
1 janv. 1992
Pour la date d''observation
Valeur
Changement absolu
Le changement par rapport à la valeur précédente
1 janv. 1971
0.689
+0.689
0.0%
1 janv. 1972
1.089
+0.401
58.17%
1 janv. 1973
1.237
+0.148
13.6%
1 janv. 1974
1.207
-0.031
-2.47%
1 janv. 1975
1.202
-0.005
-0.42%
1 janv. 1976
1.51
+0.309
25.71%
1 janv. 1977
1.679
+0.169
11.17%
1 janv. 1978
2.503
+0.824
49.1%
1 janv. 1979
2.935
+0.432
17.25%
1 janv. 1980
3.806
+0.87
29.65%
1 janv. 1981
4.602
+0.796
20.93%
1 janv. 1982
5.916
+1.314
28.56%
1 janv. 1983
4.821
-1.095
-18.51%
1 janv. 1984
6.09
+1.268
26.31%
1 janv. 1985
6.829
+0.739
12.14%
1 janv. 1986
9.288
+2.459
36.02%
1 janv. 1987
8.624
-0.665
-7.15%
1 janv. 1988
10.433
+1.81
20.98%
1 janv. 1989
14.994
+4.561
43.72%
1 janv. 1990
12.479
-2.515
-16.78%
1 janv. 1991
13.986
+1.507
12.08%
1 janv. 1992
15.833
+1.847
13.2%
1 janv. 1993
13.34
-2.492
-15.74%
1 janv. 1994
9.721
-3.619
-27.13%
1 janv. 1995
8.271
-1.45
-14.92%
1 janv. 1996
8.348
+0.077
0.93%
1 janv. 1997
13.718
+5.37
64.32%
1 janv. 1998
11.22
-2.498
-18.21%
1 janv. 1999
10.396
-0.824
-7.34%
1 janv. 2000
5.827
-4.57
-43.96%
1 janv. 2001
6.393
+0.566
9.72%
1 janv. 2002
5.828
-0.565
-8.84%
1 janv. 2003
5.009
-0.818
-14.04%
1 janv. 2004
10.028
+5.019
100.19%
1 janv. 2005
4.914
-5.114
-51.0%
1 janv. 2006
3.881
-1.033
-21.02%
1 janv. 2007
3.538
-0.343
-8.84%
1 janv. 2008
3.58
+0.042
1.18%
1 janv. 2009
11.523
+7.943
221.9%
1 janv. 2010
2.267
-9.256
-80.32%
1 janv. 2011
2.417
+0.15
6.59%
1 janv. 2012
2.607
+0.191
7.89%
1 janv. 2013
2.457
-0.15
-5.77%
1 janv. 2014
2.19
-0.267
-10.85%
1 janv. 2015
3.183
+0.993
45.32%
1 janv. 2016
4.911
+1.728
54.29%
Classement des pays selon les statistiques actuelles par années


Commentaires: