29
/fr/
fr
AIzaSyAYiBZKx7MnpbEhh9jyipgxe19OcubqV5w
April 1, 2024
190707
Mali
MLI
true
2
1
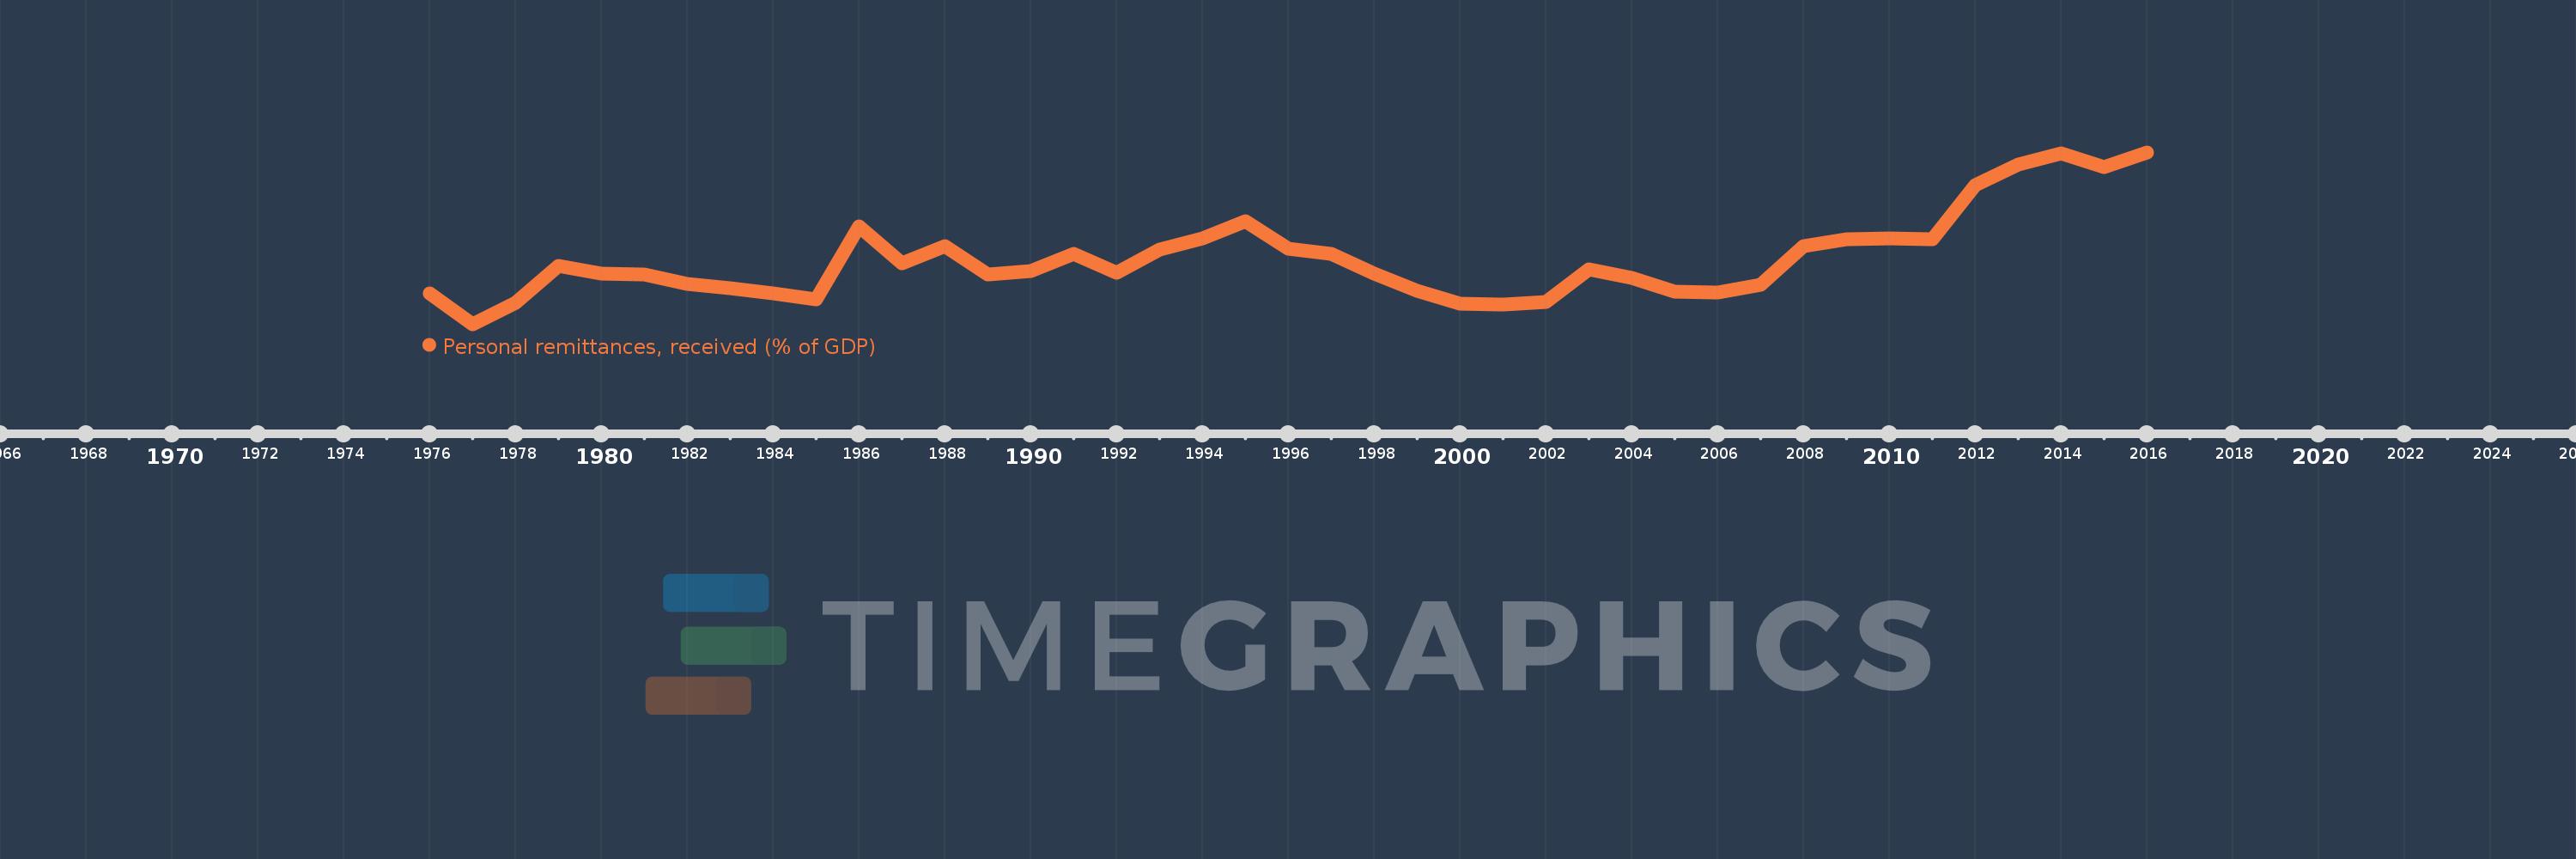
Personal remittances, received (% of GDP)
2016,2015,2014,2013,2012,2011,2010,2009,2008,2007,2006,2005,2004,2003,2002,2001,2000,1999,1998,1997,1996,1995,1994,1993,1992,1991,1990,1989,1988,1987,1986,1985,1984,1983,1982,1981,1980,1979,1978,1977,1976
Cette statistique dans les autres pays:
AfghanistanAlbaniaAlgeriaAngolaAntigua and BarbudaArab WorldArgentinaArmeniaArubaAustraliaAustriaAzerbaijanBangladeshBarbadosBelarusBelgiumBelizeBeninBermudaBhutanBoliviaBosnia and HerzegovinaBotswanaBrazilBulgariaBurkina FasoBurundiCabo VerdeCambodiaCameroonCanadaCaribbean small statesCentral African RepublicCentral Europe and the BalticsChadChileChinaColombiaComorosCongo, Dem. Rep.Congo, Rep.Costa RicaCote d'IvoireCroatiaCyprusCzech RepublicDenmarkDjiboutiDominicaDominican RepublicEarly-demographic dividendEast Asia & PacificEast Asia & Pacific (excluding high income)East Asia & Pacific (IDA & IBRD countries)EcuadorEgypt, Arab Rep.El SalvadorEquatorial GuineaEritreaEstoniaEthiopiaEuro areaEurope & Central AsiaEurope & Central Asia (excluding high income)Europe & Central Asia (IDA & IBRD countries)European UnionFaroe IslandsFijiFinlandFragile and conflict affected situationsFranceGabonGambia, TheGeorgiaGermanyGhanaGreeceGrenadaGuatemalaGuineaGuinea-BissauGuyanaHaitiHeavily indebted poor countries (HIPC)High incomeHondurasHong Kong SAR, ChinaHungaryIBRD onlyIcelandIDA & IBRD totalIDA blendIDA onlyIDA totalIndiaIndonesiaIran, Islamic Rep.IraqIrelandIsraelItalyJamaicaJapanJordanKazakhstanKenyaKiribatiKorea, Rep.KosovoKuwaitKyrgyz RepublicLao PDRLate-demographic dividendLatin America & Caribbean Latin America & Caribbean (excluding high income)Latin America & the Caribbean (IDA & IBRD countries)LatviaLeast developed countries: UN classificationLebanonLesothoLiberiaLibyaLithuaniaLow & middle incomeLow incomeLower middle incomeLuxembourgMacao SAR, ChinaMacedonia, FYRMadagascarMalawiMalaysiaMaldivesMaliMaltaMarshall IslandsMauritaniaMauritiusMexicoMicronesia, Fed. Sts.Middle East & North AfricaMiddle East & North Africa (excluding high income)Middle East & North Africa (IDA & IBRD countries)Middle incomeMoldovaMongoliaMontenegroMoroccoMozambiqueMyanmarNamibiaNepalNetherlandsNew ZealandNicaraguaNigerNigeriaNorth AmericaNorwayOECD membersOmanOther small statesPacific island small statesPakistanPalauPanamaPapua New GuineaParaguayPeruPhilippinesPolandPortugalPost-demographic dividendPre-demographic dividendQatarRomaniaRussian FederationRwandaSamoaSao Tome and PrincipeSaudi ArabiaSenegalSerbiaSeychellesSierra LeoneSlovak RepublicSloveniaSmall statesSolomon IslandsSouth AfricaSouth AsiaSouth Asia (IDA & IBRD)South SudanSpainSri LankaSt. Kitts and NevisSt. LuciaSt. Vincent and the GrenadinesSub-Saharan Africa Sub-Saharan Africa (excluding high income)Sub-Saharan Africa (IDA & IBRD countries)SudanSurinameSwazilandSwedenSwitzerlandSyrian Arab RepublicTajikistanTanzaniaThailandTimor-LesteTogoTongaTrinidad and TobagoTunisiaTurkeyTurkmenistanTuvaluUgandaUkraineUnited KingdomUnited StatesUpper middle incomeUruguayUzbekistanVanuatuVenezuela, RBVietnamWest Bank and GazaWorldYemen, Rep.ZambiaZimbabwe La ligne de temps
Cette échelle de temps montre un graphique de 1976 année à 2016 année Mali. Les données jusqu'à 1975 année ne sont pas présentés. Quantité d'observations actuelles selon dates: 41.
Source (désignation):
Les indicateurs du développement mondiale
Source (organisation):
World Bank staff estimates based on IMF balance of payments data, and World Bank and OECD GDP estimates.
Catégories:
Economy & Growth, Financial Sector
Dernière mise à jour
23 avr. 2017
Les indicateurs de changement de valeurs selon les années
Minimum:
1.889
1 janv. 1977
Maximum:
7.018
1 janv. 2016
Pour la date d''observation
Valeur
Changement absolu
Le changement par rapport à la valeur précédente
1 janv. 1976
2.806
+2.806
0.0%
1 janv. 1977
1.889
-0.916
-32.66%
1 janv. 1978
2.524
+0.635
33.6%
1 janv. 1979
3.624
+1.1
43.6%
1 janv. 1980
3.389
-0.236
-6.51%
1 janv. 1981
3.376
-0.013
-0.38%
1 janv. 1982
3.097
-0.279
-8.26%
1 janv. 1983
2.955
-0.142
-4.58%
1 janv. 1984
2.811
-0.144
-4.87%
1 janv. 1985
2.636
-0.175
-6.22%
1 janv. 1986
4.812
+2.177
82.58%
1 janv. 1987
3.695
-1.117
-23.22%
1 janv. 1988
4.218
+0.523
14.15%
1 janv. 1989
3.376
-0.842
-19.96%
1 janv. 1990
3.481
+0.105
3.12%
1 janv. 1991
3.987
+0.505
14.52%
1 janv. 1992
3.414
-0.572
-14.35%
1 janv. 1993
4.117
+0.703
20.59%
1 janv. 1994
4.457
+0.34
8.25%
1 janv. 1995
4.957
+0.499
11.2%
1 janv. 1996
4.142
-0.814
-16.43%
1 janv. 1997
3.982
-0.16
-3.87%
1 janv. 1998
3.401
-0.581
-14.6%
1 janv. 1999
2.892
-0.509
-14.96%
1 janv. 2000
2.509
-0.383
-13.24%
1 janv. 2001
2.477
-0.033
-1.3%
1 janv. 2002
2.544
+0.068
2.73%
1 janv. 2003
3.539
+0.995
39.09%
1 janv. 2004
3.27
-0.269
-7.6%
1 janv. 2005
2.855
-0.414
-12.67%
1 janv. 2006
2.837
-0.018
-0.64%
1 janv. 2007
3.07
+0.233
8.21%
1 janv. 2008
4.222
+1.152
37.52%
1 janv. 2009
4.42
+0.198
4.69%
1 janv. 2010
4.457
+0.037
0.83%
1 janv. 2011
4.427
-0.03
-0.67%
1 janv. 2012
6.042
+1.615
36.48%
1 janv. 2013
6.65
+0.608
10.07%
1 janv. 2014
6.981
+0.331
4.98%
1 janv. 2015
6.571
-0.41
-5.87%
1 janv. 2016
7.018
+0.446
6.79%
Classement des pays selon les statistiques actuelles par années


Commentaires: