29
/fr/
fr
AIzaSyAYiBZKx7MnpbEhh9jyipgxe19OcubqV5w
April 1, 2024
155090
India
IND
true
2
1
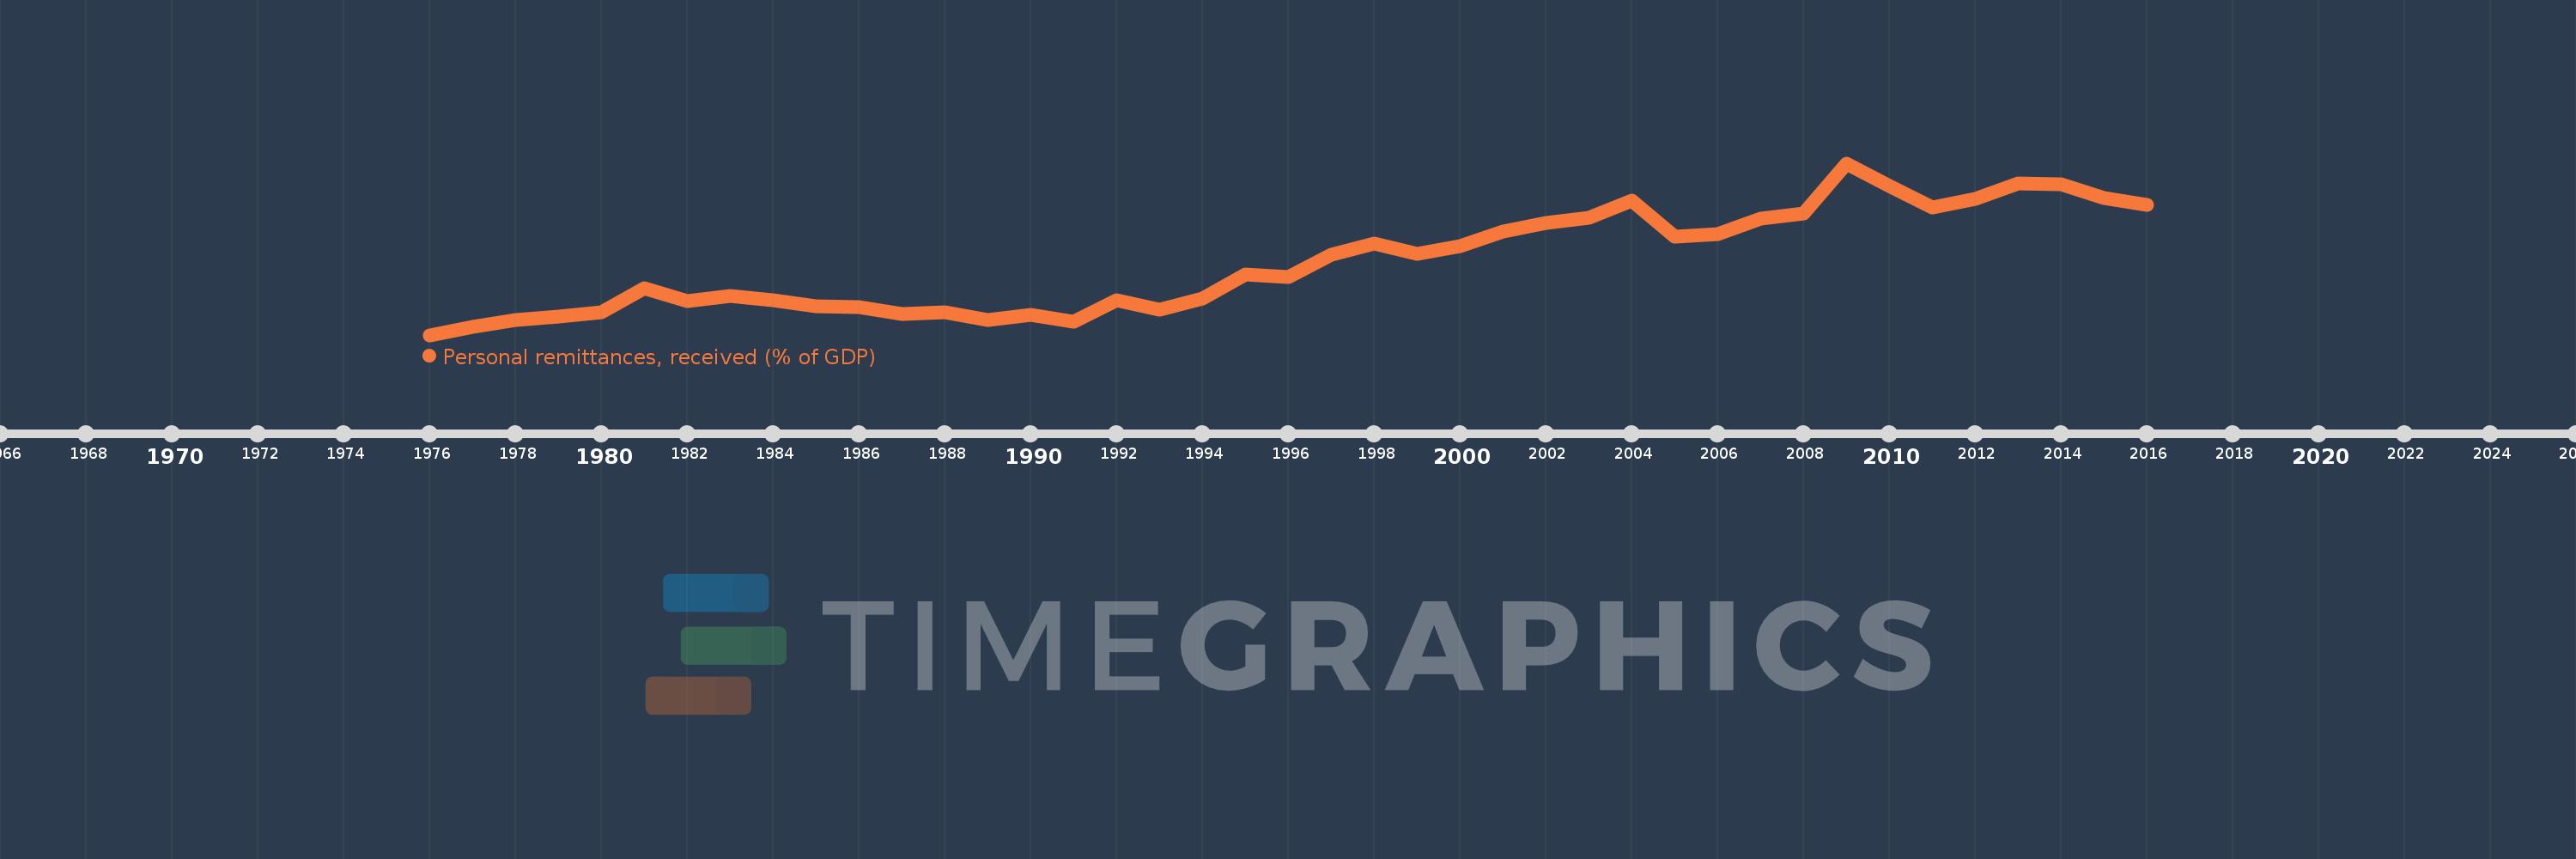
Personal remittances, received (% of GDP)
2016,2015,2014,2013,2012,2011,2010,2009,2008,2007,2006,2005,2004,2003,2002,2001,2000,1999,1998,1997,1996,1995,1994,1993,1992,1991,1990,1989,1988,1987,1986,1985,1984,1983,1982,1981,1980,1979,1978,1977,1976
Cette statistique dans les autres pays:
AfghanistanAlbaniaAlgeriaAngolaAntigua and BarbudaArab WorldArgentinaArmeniaArubaAustraliaAustriaAzerbaijanBangladeshBarbadosBelarusBelgiumBelizeBeninBermudaBhutanBoliviaBosnia and HerzegovinaBotswanaBrazilBulgariaBurkina FasoBurundiCabo VerdeCambodiaCameroonCanadaCaribbean small statesCentral African RepublicCentral Europe and the BalticsChadChileChinaColombiaComorosCongo, Dem. Rep.Congo, Rep.Costa RicaCote d'IvoireCroatiaCyprusCzech RepublicDenmarkDjiboutiDominicaDominican RepublicEarly-demographic dividendEast Asia & PacificEast Asia & Pacific (excluding high income)East Asia & Pacific (IDA & IBRD countries)EcuadorEgypt, Arab Rep.El SalvadorEquatorial GuineaEritreaEstoniaEthiopiaEuro areaEurope & Central AsiaEurope & Central Asia (excluding high income)Europe & Central Asia (IDA & IBRD countries)European UnionFaroe IslandsFijiFinlandFragile and conflict affected situationsFranceGabonGambia, TheGeorgiaGermanyGhanaGreeceGrenadaGuatemalaGuineaGuinea-BissauGuyanaHaitiHeavily indebted poor countries (HIPC)High incomeHondurasHong Kong SAR, ChinaHungaryIBRD onlyIcelandIDA & IBRD totalIDA blendIDA onlyIDA totalIndiaIndonesiaIran, Islamic Rep.IraqIrelandIsraelItalyJamaicaJapanJordanKazakhstanKenyaKiribatiKorea, Rep.KosovoKuwaitKyrgyz RepublicLao PDRLate-demographic dividendLatin America & Caribbean Latin America & Caribbean (excluding high income)Latin America & the Caribbean (IDA & IBRD countries)LatviaLeast developed countries: UN classificationLebanonLesothoLiberiaLibyaLithuaniaLow & middle incomeLow incomeLower middle incomeLuxembourgMacao SAR, ChinaMacedonia, FYRMadagascarMalawiMalaysiaMaldivesMaliMaltaMarshall IslandsMauritaniaMauritiusMexicoMicronesia, Fed. Sts.Middle East & North AfricaMiddle East & North Africa (excluding high income)Middle East & North Africa (IDA & IBRD countries)Middle incomeMoldovaMongoliaMontenegroMoroccoMozambiqueMyanmarNamibiaNepalNetherlandsNew ZealandNicaraguaNigerNigeriaNorth AmericaNorwayOECD membersOmanOther small statesPacific island small statesPakistanPalauPanamaPapua New GuineaParaguayPeruPhilippinesPolandPortugalPost-demographic dividendPre-demographic dividendQatarRomaniaRussian FederationRwandaSamoaSao Tome and PrincipeSaudi ArabiaSenegalSerbiaSeychellesSierra LeoneSlovak RepublicSloveniaSmall statesSolomon IslandsSouth AfricaSouth AsiaSouth Asia (IDA & IBRD)South SudanSpainSri LankaSt. Kitts and NevisSt. LuciaSt. Vincent and the GrenadinesSub-Saharan Africa Sub-Saharan Africa (excluding high income)Sub-Saharan Africa (IDA & IBRD countries)SudanSurinameSwazilandSwedenSwitzerlandSyrian Arab RepublicTajikistanTanzaniaThailandTimor-LesteTogoTongaTrinidad and TobagoTunisiaTurkeyTurkmenistanTuvaluUgandaUkraineUnited KingdomUnited StatesUpper middle incomeUruguayUzbekistanVanuatuVenezuela, RBVietnamWest Bank and GazaWorldYemen, Rep.ZambiaZimbabwe La ligne de temps
Cette échelle de temps montre un graphique de 1976 année à 2016 année India. Les données jusqu'à 1975 année ne sont pas présentés. Quantité d'observations actuelles selon dates: 41.
Source (désignation):
Les indicateurs du développement mondiale
Source (organisation):
World Bank staff estimates based on IMF balance of payments data, and World Bank and OECD GDP estimates.
Catégories:
Economy & Growth, Financial Sector
Dernière mise à jour
23 avr. 2017
Les indicateurs de changement de valeurs selon les années
Minimum:
0.429
1 janv. 1976
Maximum:
4.211
1 janv. 2009
Pour la date d''observation
Valeur
Changement absolu
Le changement par rapport à la valeur précédente
1 janv. 1976
0.429
+0.429
0.0%
1 janv. 1977
0.615
+0.186
43.25%
1 janv. 1978
0.756
+0.141
22.99%
1 janv. 1979
0.834
+0.078
10.3%
1 janv. 1980
0.923
+0.089
10.72%
1 janv. 1981
1.454
+0.531
57.53%
1 janv. 1982
1.169
-0.285
-19.62%
1 janv. 1983
1.282
+0.113
9.65%
1 janv. 1984
1.198
-0.084
-6.55%
1 janv. 1985
1.063
-0.135
-11.25%
1 janv. 1986
1.044
-0.019
-1.82%
1 janv. 1987
0.884
-0.16
-15.29%
1 janv. 1988
0.939
+0.055
6.18%
1 janv. 1989
0.767
-0.172
-18.28%
1 janv. 1990
0.868
+0.101
13.1%
1 janv. 1991
0.73
-0.138
-15.89%
1 janv. 1992
1.197
+0.467
63.97%
1 janv. 1993
0.988
-0.209
-17.44%
1 janv. 1994
1.24
+0.252
25.46%
1 janv. 1995
1.759
+0.519
41.88%
1 janv. 1996
1.697
-0.061
-3.48%
1 janv. 1997
2.193
+0.495
29.17%
1 janv. 1998
2.441
+0.249
11.35%
1 janv. 1999
2.211
-0.23
-9.44%
1 janv. 2000
2.383
+0.172
7.77%
1 janv. 2001
2.703
+0.32
13.45%
1 janv. 2002
2.89
+0.186
6.9%
1 janv. 2003
3.003
+0.114
3.93%
1 janv. 2004
3.396
+0.393
13.08%
1 janv. 2005
2.598
-0.797
-23.48%
1 janv. 2006
2.652
+0.054
2.07%
1 janv. 2007
2.985
+0.333
12.56%
1 janv. 2008
3.099
+0.113
3.8%
1 janv. 2009
4.211
+1.112
35.89%
1 janv. 2010
3.717
-0.494
-11.73%
1 janv. 2011
3.228
-0.488
-13.14%
1 janv. 2012
3.428
+0.2
6.2%
1 janv. 2013
3.763
+0.334
9.75%
1 janv. 2014
3.755
-0.007
-0.2%
1 janv. 2015
3.446
-0.309
-8.23%
1 janv. 2016
3.289
-0.158
-4.58%
Classement des pays selon les statistiques actuelles par années


Commentaires: