29
/fr/
fr
AIzaSyAYiBZKx7MnpbEhh9jyipgxe19OcubqV5w
April 1, 2024
181977
Luxembourg
LUX
true
2
1
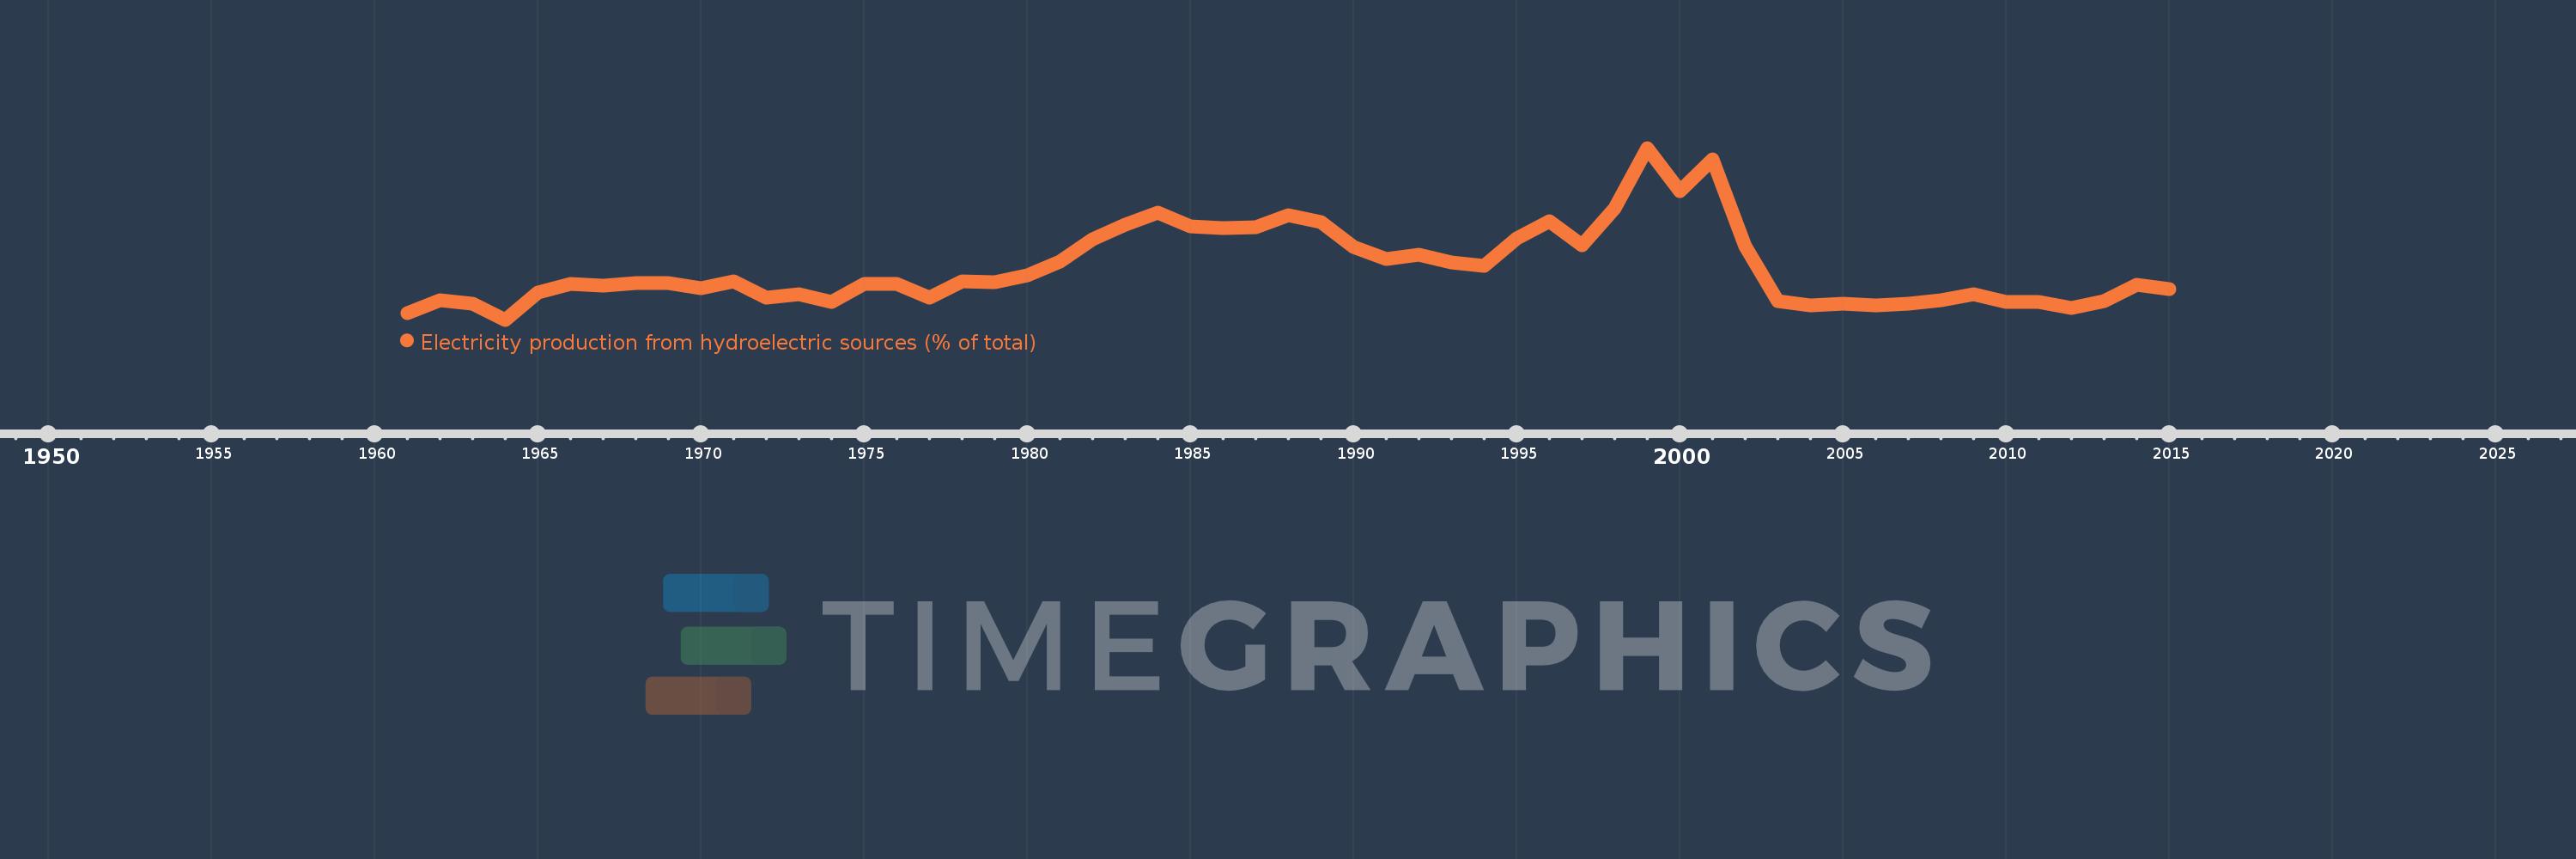
Electricity production from hydroelectric sources (% of total)
2015,2014,2013,2012,2011,2010,2009,2008,2007,2006,2005,2004,2003,2002,2001,2000,1999,1998,1997,1996,1995,1994,1993,1992,1991,1990,1989,1988,1987,1986,1985,1984,1983,1982,1981,1980,1979,1978,1977,1976,1975,1974,1973,1972,1971,1970,1969,1968,1967,1966,1965,1964,1963,1962,1961
Cette statistique dans les autres pays:
AlbaniaAlgeriaAngolaArab WorldArgentinaArmeniaAustraliaAustriaAzerbaijanBahrainBangladeshBelarusBelgiumBeninBoliviaBosnia and HerzegovinaBotswanaBrazilBrunei DarussalamBulgariaCambodiaCameroonCanadaCentral Europe and the BalticsChileChinaColombiaCongo, Dem. Rep.Congo, Rep.Costa RicaCote d'IvoireCroatiaCubaCuracaoCyprusCzech RepublicDenmarkDominican RepublicEarly-demographic dividendEast Asia & PacificEast Asia & Pacific (excluding high income)East Asia & Pacific (IDA & IBRD countries)EcuadorEgypt, Arab Rep.El SalvadorEritreaEstoniaEthiopiaEuro areaEurope & Central AsiaEurope & Central Asia (excluding high income)Europe & Central Asia (IDA & IBRD countries)European UnionFinlandFragile and conflict affected situationsFranceGabonGeorgiaGermanyGhanaGibraltarGreeceGuatemalaHaitiHeavily indebted poor countries (HIPC)High incomeHondurasHong Kong SAR, ChinaHungaryIBRD onlyIcelandIDA & IBRD totalIDA blendIDA onlyIDA totalIndiaIndonesiaIran, Islamic Rep.IraqIrelandIsraelItalyJamaicaJapanJordanKazakhstanKenyaKorea, Dem. People’s Rep.Korea, Rep.KosovoKuwaitKyrgyz RepublicLate-demographic dividendLatin America & Caribbean Latin America & Caribbean (excluding high income)Latin America & the Caribbean (IDA & IBRD countries)LatviaLeast developed countries: UN classificationLebanonLibyaLithuaniaLow & middle incomeLower middle incomeLuxembourgMacedonia, FYRMalaysiaMaltaMauritiusMexicoMiddle East & North AfricaMiddle East & North Africa (excluding high income)Middle East & North Africa (IDA & IBRD countries)Middle incomeMoldovaMongoliaMontenegroMoroccoMozambiqueMyanmarNamibiaNepalNetherlandsNew ZealandNicaraguaNigerNigeriaNorth AmericaNorwayOECD membersOmanOther small statesPakistanPanamaParaguayPeruPhilippinesPolandPortugalPost-demographic dividendPre-demographic dividendQatarRomaniaRussian FederationSaudi ArabiaSenegalSerbiaSingaporeSlovak RepublicSloveniaSmall statesSouth AfricaSouth AsiaSouth Asia (IDA & IBRD)South SudanSpainSri LankaSub-Saharan Africa Sub-Saharan Africa (excluding high income)Sub-Saharan Africa (IDA & IBRD countries)SudanSwedenSwitzerlandSyrian Arab RepublicTajikistanTanzaniaThailandTogoTrinidad and TobagoTunisiaTurkeyTurkmenistanUkraineUnited Arab EmiratesUnited KingdomUnited StatesUpper middle incomeUruguayUzbekistanVenezuela, RBVietnamWorldYemen, Rep.ZambiaZimbabwe La ligne de temps
Cette échelle de temps montre un graphique de 1961 année à 2015 année Luxembourg. Les données jusqu'à 1960 année ne sont pas présentés. Quantité d'observations actuelles selon dates: 55.
Source (désignation):
Les indicateurs du développement mondiale
Source (organisation):
IEA Statistics © OECD/IEA 2014 (http://www.iea.org/stats/index.asp), subject to https://www.iea.org/t&c/termsandconditions/
Catégories:
Energy & Mining, Climate Change, Infrastructure
Dernière mise à jour
23 avr. 2017
Les indicateurs de changement de valeurs selon les années
Minimum:
0.148
1 janv. 1964
Maximum:
31.421
1 janv. 1999
Pour la date d''observation
Valeur
Changement absolu
Le changement par rapport à la valeur précédente
1 janv. 1961
1.366
+1.366
0.0%
1 janv. 1962
3.73
+2.364
173.06%
1 janv. 1963
3.082
-0.648
-17.38%
1 janv. 1964
0.148
-2.935
-95.21%
1 janv. 1965
5.047
+4.9
3.32 milles%
1 janv. 1966
6.649
+1.602
31.73%
1 janv. 1967
6.433
-0.216
-3.24%
1 janv. 1968
6.899
+0.466
7.24%
1 janv. 1969
6.887
-0.012
-0.18%
1 janv. 1970
5.903
-0.984
-14.29%
1 janv. 1971
7.074
+1.172
19.85%
1 janv. 1972
4.126
-2.948
-41.68%
1 janv. 1973
4.751
+0.625
15.16%
1 janv. 1974
3.372
-1.38
-29.04%
1 janv. 1975
6.683
+3.311
98.21%
1 janv. 1976
6.736
+0.053
0.8%
1 janv. 1977
4.197
-2.539
-37.69%
1 janv. 1978
7.13
+2.933
69.89%
1 janv. 1979
6.936
-0.194
-2.73%
1 janv. 1980
8.288
+1.352
19.49%
1 janv. 1981
10.675
+2.388
28.81%
1 janv. 1982
14.835
+4.16
38.97%
1 janv. 1983
17.528
+2.693
18.15%
1 janv. 1984
19.574
+2.047
11.68%
1 janv. 1985
17.1
-2.474
-12.64%
1 janv. 1986
16.763
-0.337
-1.97%
1 janv. 1987
17.007
+0.244
1.45%
1 janv. 1988
19.204
+2.197
12.92%
1 janv. 1989
17.857
-1.347
-7.01%
1 janv. 1990
13.449
-4.408
-24.68%
1 janv. 1991
11.218
-2.231
-16.59%
1 janv. 1992
11.983
+0.765
6.82%
1 janv. 1993
10.606
-1.377
-11.49%
1 janv. 1994
9.985
-0.621
-5.85%
1 janv. 1995
14.905
+4.92
49.27%
1 janv. 1996
18.07
+3.165
21.24%
1 janv. 1997
13.636
-4.433
-24.54%
1 janv. 1998
20.443
+6.807
49.92%
1 janv. 1999
31.421
+10.977
53.7%
1 janv. 2000
23.611
-7.81
-24.86%
1 janv. 2001
29.384
+5.773
24.45%
1 janv. 2002
13.61
-15.774
-53.68%
1 janv. 2003
3.526
-10.085
-74.1%
1 janv. 2004
2.833
-0.693
-19.66%
1 janv. 2005
3.075
+0.243
8.56%
1 janv. 2006
2.808
-0.267
-8.7%
1 janv. 2007
3.145
+0.338
12.03%
1 janv. 2008
3.655
+0.51
16.21%
1 janv. 2009
4.842
+1.187
32.48%
1 janv. 2010
3.363
-1.479
-30.55%
1 janv. 2011
3.344
-0.019
-0.57%
1 janv. 2012
2.34
-1.004
-30.03%
1 janv. 2013
3.591
+1.251
53.48%
1 janv. 2014
6.436
+2.845
79.23%
1 janv. 2015
5.716
-0.72
-11.19%
Classement des pays selon les statistiques actuelles par années


Commentaires: