29
/fr/
fr
AIzaSyAYiBZKx7MnpbEhh9jyipgxe19OcubqV5w
April 1, 2024
155860
Indonesia
IDN
true
2
1
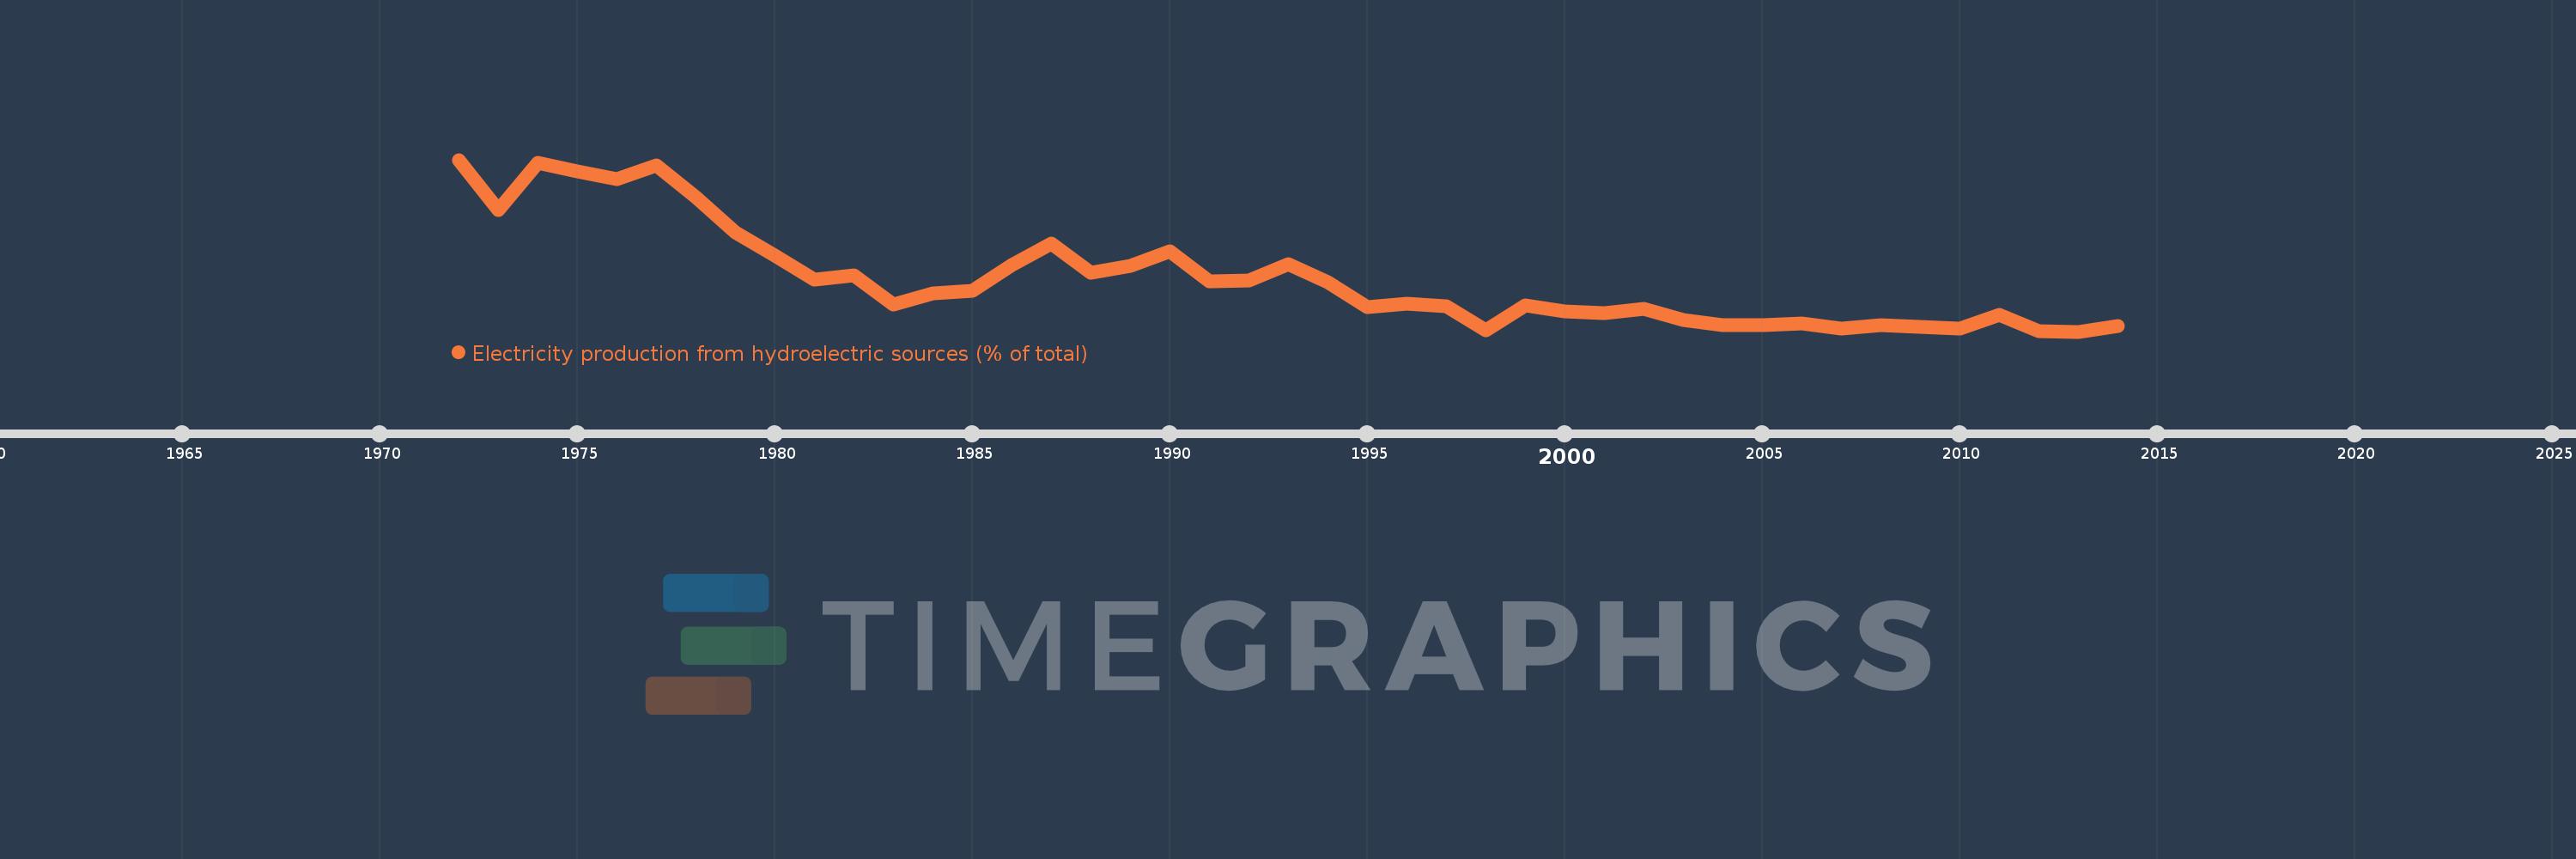
Electricity production from hydroelectric sources (% of total)
2014,2013,2012,2011,2010,2009,2008,2007,2006,2005,2004,2003,2002,2001,2000,1999,1998,1997,1996,1995,1994,1993,1992,1991,1990,1989,1988,1987,1986,1985,1984,1983,1982,1981,1980,1979,1978,1977,1976,1975,1974,1973,1972
Cette statistique dans les autres pays:
AlbaniaAlgeriaAngolaArab WorldArgentinaArmeniaAustraliaAustriaAzerbaijanBahrainBangladeshBelarusBelgiumBeninBoliviaBosnia and HerzegovinaBotswanaBrazilBrunei DarussalamBulgariaCambodiaCameroonCanadaCentral Europe and the BalticsChileChinaColombiaCongo, Dem. Rep.Congo, Rep.Costa RicaCote d'IvoireCroatiaCubaCuracaoCyprusCzech RepublicDenmarkDominican RepublicEarly-demographic dividendEast Asia & PacificEast Asia & Pacific (excluding high income)East Asia & Pacific (IDA & IBRD countries)EcuadorEgypt, Arab Rep.El SalvadorEritreaEstoniaEthiopiaEuro areaEurope & Central AsiaEurope & Central Asia (excluding high income)Europe & Central Asia (IDA & IBRD countries)European UnionFinlandFragile and conflict affected situationsFranceGabonGeorgiaGermanyGhanaGibraltarGreeceGuatemalaHaitiHeavily indebted poor countries (HIPC)High incomeHondurasHong Kong SAR, ChinaHungaryIBRD onlyIcelandIDA & IBRD totalIDA blendIDA onlyIDA totalIndiaIndonesiaIran, Islamic Rep.IraqIrelandIsraelItalyJamaicaJapanJordanKazakhstanKenyaKorea, Dem. People’s Rep.Korea, Rep.KosovoKuwaitKyrgyz RepublicLate-demographic dividendLatin America & Caribbean Latin America & Caribbean (excluding high income)Latin America & the Caribbean (IDA & IBRD countries)LatviaLeast developed countries: UN classificationLebanonLibyaLithuaniaLow & middle incomeLower middle incomeLuxembourgMacedonia, FYRMalaysiaMaltaMauritiusMexicoMiddle East & North AfricaMiddle East & North Africa (excluding high income)Middle East & North Africa (IDA & IBRD countries)Middle incomeMoldovaMongoliaMontenegroMoroccoMozambiqueMyanmarNamibiaNepalNetherlandsNew ZealandNicaraguaNigerNigeriaNorth AmericaNorwayOECD membersOmanOther small statesPakistanPanamaParaguayPeruPhilippinesPolandPortugalPost-demographic dividendPre-demographic dividendQatarRomaniaRussian FederationSaudi ArabiaSenegalSerbiaSingaporeSlovak RepublicSloveniaSmall statesSouth AfricaSouth AsiaSouth Asia (IDA & IBRD)South SudanSpainSri LankaSub-Saharan Africa Sub-Saharan Africa (excluding high income)Sub-Saharan Africa (IDA & IBRD countries)SudanSwedenSwitzerlandSyrian Arab RepublicTajikistanTanzaniaThailandTogoTrinidad and TobagoTunisiaTurkeyTurkmenistanUkraineUnited Arab EmiratesUnited KingdomUnited StatesUpper middle incomeUruguayUzbekistanVenezuela, RBVietnamWorldYemen, Rep.ZambiaZimbabwe La ligne de temps
Cette échelle de temps montre un graphique de 1972 année à 2014 année Indonesia. Les données jusqu'à 1971 année ne sont pas présentés. Quantité d'observations actuelles selon dates: 43.
Source (désignation):
Les indicateurs du développement mondiale
Source (organisation):
IEA Statistics © OECD/IEA 2014 (http://www.iea.org/stats/index.asp), subject to https://www.iea.org/t&c/termsandconditions/
Catégories:
Energy & Mining, Climate Change, Infrastructure
Dernière mise à jour
23 avr. 2017
Les indicateurs de changement de valeurs selon les années
Minimum:
6.628
1 janv. 2013
Maximum:
44.021
1 janv. 1972
Pour la date d''observation
Valeur
Changement absolu
Le changement par rapport à la valeur précédente
1 janv. 1972
44.021
+44.021
0.0%
1 janv. 1973
33.05
-10.971
-24.92%
1 janv. 1974
43.46
+10.41
31.5%
1 janv. 1975
41.581
-1.879
-4.32%
1 janv. 1976
39.9
-1.681
-4.04%
1 janv. 1977
42.824
+2.924
7.33%
1 janv. 1978
35.873
-6.95
-16.23%
1 janv. 1979
28.193
-7.68
-21.41%
1 janv. 1980
23.125
-5.068
-17.98%
1 janv. 1981
17.929
-5.197
-22.47%
1 janv. 1982
18.926
+0.998
5.57%
1 janv. 1983
12.467
-6.46
-34.13%
1 janv. 1984
14.996
+2.529
20.29%
1 janv. 1985
15.548
+0.553
3.68%
1 janv. 1986
21.209
+5.66
36.4%
1 janv. 1987
25.786
+4.577
21.58%
1 janv. 1988
19.399
-6.386
-24.77%
1 janv. 1989
20.956
+1.556
8.02%
1 janv. 1990
24.13
+3.175
15.15%
1 janv. 1991
17.473
-6.657
-27.59%
1 janv. 1992
17.748
+0.274
1.57%
1 janv. 1993
21.227
+3.479
19.6%
1 janv. 1994
17.366
-3.861
-18.19%
1 janv. 1995
11.881
-5.484
-31.58%
1 janv. 1996
12.721
+0.84
7.07%
1 janv. 1997
12.05
-0.671
-5.27%
1 janv. 1998
6.842
-5.208
-43.22%
1 janv. 1999
12.405
+5.563
81.31%
1 janv. 2000
10.942
-1.463
-11.8%
1 janv. 2001
10.732
-0.21
-1.92%
1 janv. 2002
11.511
+0.778
7.25%
1 janv. 2003
9.179
-2.332
-20.26%
1 janv. 2004
8.054
-1.125
-12.25%
1 janv. 2005
8.051
-0.003
-0.04%
1 janv. 2006
8.41
+0.359
4.46%
1 janv. 2007
7.231
-1.178
-14.01%
1 janv. 2008
7.939
+0.708
9.79%
1 janv. 2009
7.72
-0.219
-2.76%
1 janv. 2010
7.261
-0.459
-5.94%
1 janv. 2011
10.283
+3.022
41.61%
1 janv. 2012
6.775
-3.508
-34.12%
1 janv. 2013
6.628
-0.147
-2.18%
1 janv. 2014
7.853
+1.225
18.49%
Classement des pays selon les statistiques actuelles par années


Commentaires: