29
/fr/
fr
AIzaSyAYiBZKx7MnpbEhh9jyipgxe19OcubqV5w
April 1, 2024
167163
Kenya
KEN
true
2
1
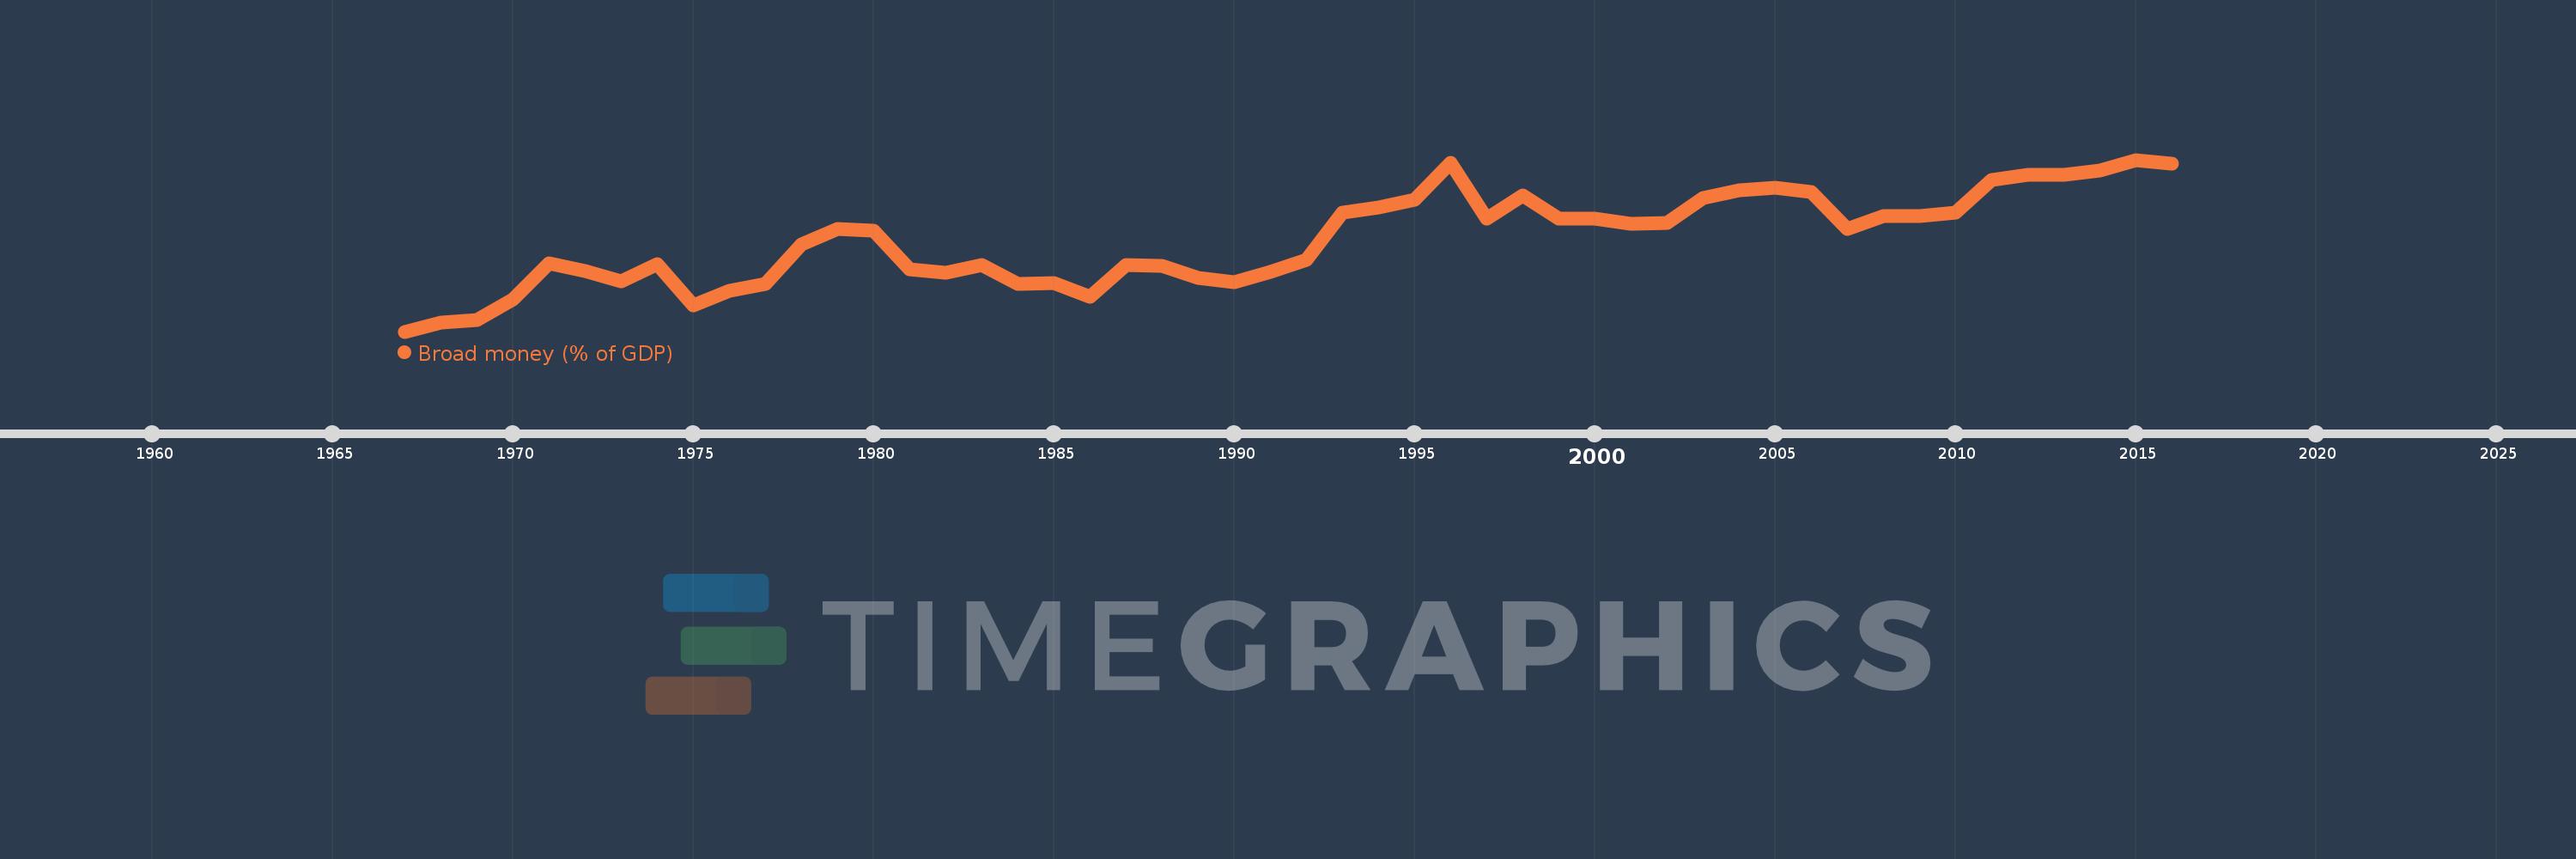
Broad money (% of GDP)
2016,2015,2014,2013,2012,2011,2010,2009,2008,2007,2006,2005,2004,2003,2002,2001,2000,1999,1998,1997,1996,1995,1994,1993,1992,1991,1990,1989,1988,1987,1986,1985,1984,1983,1982,1981,1980,1979,1978,1977,1976,1975,1974,1973,1972,1971,1970,1969,1968,1967
Cette statistique dans les autres pays:
AfghanistanAlbaniaAlgeriaAngolaAntigua and BarbudaArab WorldArgentinaArmeniaArubaAustraliaAzerbaijanBahamas, TheBahrainBangladeshBarbadosBelarusBelizeBeninBhutanBoliviaBosnia and HerzegovinaBotswanaBrazilBrunei DarussalamBulgariaBurkina FasoBurundiCabo VerdeCambodiaCameroonCanadaCaribbean small statesCentral African RepublicCentral Europe and the BalticsChadChileChinaColombiaComorosCongo, Dem. Rep.Congo, Rep.Costa RicaCote d'IvoireCroatiaCzech RepublicDenmarkDjiboutiDominicaDominican RepublicEarly-demographic dividendEast Asia & PacificEast Asia & Pacific (excluding high income)East Asia & Pacific (IDA & IBRD countries)EcuadorEgypt, Arab Rep.El SalvadorEquatorial GuineaEritreaEstoniaEthiopiaEurope & Central Asia (excluding high income)Europe & Central Asia (IDA & IBRD countries)FijiFragile and conflict affected situationsGabonGambia, TheGeorgiaGhanaGrenadaGuatemalaGuineaGuinea-BissauGuyanaHaitiHeavily indebted poor countries (HIPC)High incomeHondurasHong Kong SAR, ChinaHungaryIBRD onlyIcelandIDA & IBRD totalIDA blendIDA onlyIDA totalIndiaIndonesiaIran, Islamic Rep.IraqIsraelJamaicaJapanJordanKazakhstanKenyaKorea, Rep.KuwaitKyrgyz RepublicLao PDRLate-demographic dividendLatin America & Caribbean Latin America & Caribbean (excluding high income)Latin America & the Caribbean (IDA & IBRD countries)LatviaLeast developed countries: UN classificationLebanonLesothoLiberiaLibyaLithuaniaLow & middle incomeLow incomeLower middle incomeMacao SAR, ChinaMacedonia, FYRMadagascarMalawiMalaysiaMaldivesMaliMauritaniaMauritiusMexicoMicronesia, Fed. Sts.Middle East & North AfricaMiddle East & North Africa (excluding high income)Middle East & North Africa (IDA & IBRD countries)Middle incomeMoldovaMongoliaMoroccoMozambiqueMyanmarNamibiaNepalNew ZealandNicaraguaNigerNigeriaNorth AmericaNorwayOECD membersOmanOther small statesPacific island small statesPakistanPanamaPapua New GuineaParaguayPeruPhilippinesPolandPost-demographic dividendPre-demographic dividendQatarRomaniaRussian FederationRwandaSamoaSao Tome and PrincipeSaudi ArabiaSenegalSerbiaSeychellesSierra LeoneSingaporeSlovak RepublicSmall statesSolomon IslandsSouth AfricaSouth AsiaSouth Asia (IDA & IBRD)South SudanSri LankaSt. Kitts and NevisSt. LuciaSt. Vincent and the GrenadinesSub-Saharan Africa Sub-Saharan Africa (excluding high income)Sub-Saharan Africa (IDA & IBRD countries)SudanSurinameSwazilandSwedenSwitzerlandSyrian Arab RepublicTajikistanTanzaniaThailandTimor-LesteTogoTongaTrinidad and TobagoTunisiaTurkeyUgandaUkraineUnited Arab EmiratesUnited KingdomUnited StatesUpper middle incomeUruguayVanuatuVenezuela, RBVietnamWest Bank and GazaWorldYemen, Rep.ZambiaZimbabwe La ligne de temps
Cette échelle de temps montre un graphique de 1967 année à 2016 année Kenya. Les données jusqu'à 1966 année ne sont pas présentés. Quantité d'observations actuelles selon dates: 50.
Source (désignation):
Les indicateurs du développement mondiale
Source (organisation):
International Monetary Fund, International Financial Statistics and data files, and World Bank and OECD GDP estimates.
Catégories:
Financial Sector
Dernière mise à jour
23 avr. 2017
Les indicateurs de changement de valeurs selon les années
Minimum:
22.662
1 janv. 1967
Maximum:
42.606
1 janv. 2015
Pour la date d''observation
Valeur
Changement absolu
Le changement par rapport à la valeur précédente
1 janv. 1967
22.662
+22.662
0.0%
1 janv. 1968
23.694
+1.032
4.55%
1 janv. 1969
23.97
+0.276
1.16%
1 janv. 1970
26.376
+2.406
10.04%
1 janv. 1971
30.607
+4.231
16.04%
1 janv. 1972
29.674
-0.932
-3.05%
1 janv. 1973
28.536
-1.139
-3.84%
1 janv. 1974
30.491
+1.956
6.85%
1 janv. 1975
25.71
-4.781
-15.68%
1 janv. 1976
27.395
+1.684
6.55%
1 janv. 1977
28.182
+0.787
2.87%
1 janv. 1978
32.796
+4.614
16.37%
1 janv. 1979
34.529
+1.733
5.29%
1 janv. 1980
34.355
-0.174
-0.5%
1 janv. 1981
29.931
-4.423
-12.88%
1 janv. 1982
29.47
-0.461
-1.54%
1 janv. 1983
30.42
+0.95
3.22%
1 janv. 1984
28.176
-2.245
-7.38%
1 janv. 1985
28.342
+0.166
0.59%
1 janv. 1986
26.682
-1.66
-5.86%
1 janv. 1987
30.388
+3.706
13.89%
1 janv. 1988
30.244
-0.144
-0.47%
1 janv. 1989
28.901
-1.343
-4.44%
1 janv. 1990
28.399
-0.502
-1.74%
1 janv. 1991
29.577
+1.178
4.15%
1 janv. 1992
30.982
+1.405
4.75%
1 janv. 1993
36.518
+5.536
17.87%
1 janv. 1994
37.065
+0.547
1.5%
1 janv. 1995
38.016
+0.951
2.57%
1 janv. 1996
42.232
+4.216
11.09%
1 janv. 1997
35.792
-6.441
-15.25%
1 janv. 1998
38.423
+2.631
7.35%
1 janv. 1999
35.807
-2.615
-6.81%
1 janv. 2000
35.771
-0.036
-0.1%
1 janv. 2001
35.165
-0.606
-1.69%
1 janv. 2002
35.241
+0.076
0.22%
1 janv. 2003
38.159
+2.918
8.28%
1 janv. 2004
39.023
+0.864
2.26%
1 janv. 2005
39.327
+0.304
0.78%
1 janv. 2006
38.907
-0.42
-1.07%
1 janv. 2007
34.602
-4.305
-11.07%
1 janv. 2008
36.065
+1.463
4.23%
1 janv. 2009
36.105
+0.041
0.11%
1 janv. 2010
36.459
+0.353
0.98%
1 janv. 2011
40.31
+3.851
10.56%
1 janv. 2012
40.855
+0.545
1.35%
1 janv. 2013
40.864
+0.01
0.02%
1 janv. 2014
41.406
+0.542
1.33%
1 janv. 2015
42.606
+1.2
2.9%
1 janv. 2016
42.184
-0.423
-0.99%
Classement des pays selon les statistiques actuelles par années


Commentaires: