29
/fr/
fr
AIzaSyAYiBZKx7MnpbEhh9jyipgxe19OcubqV5w
April 1, 2024
157014
Iran, Islamic Rep.
IRN
true
2
1
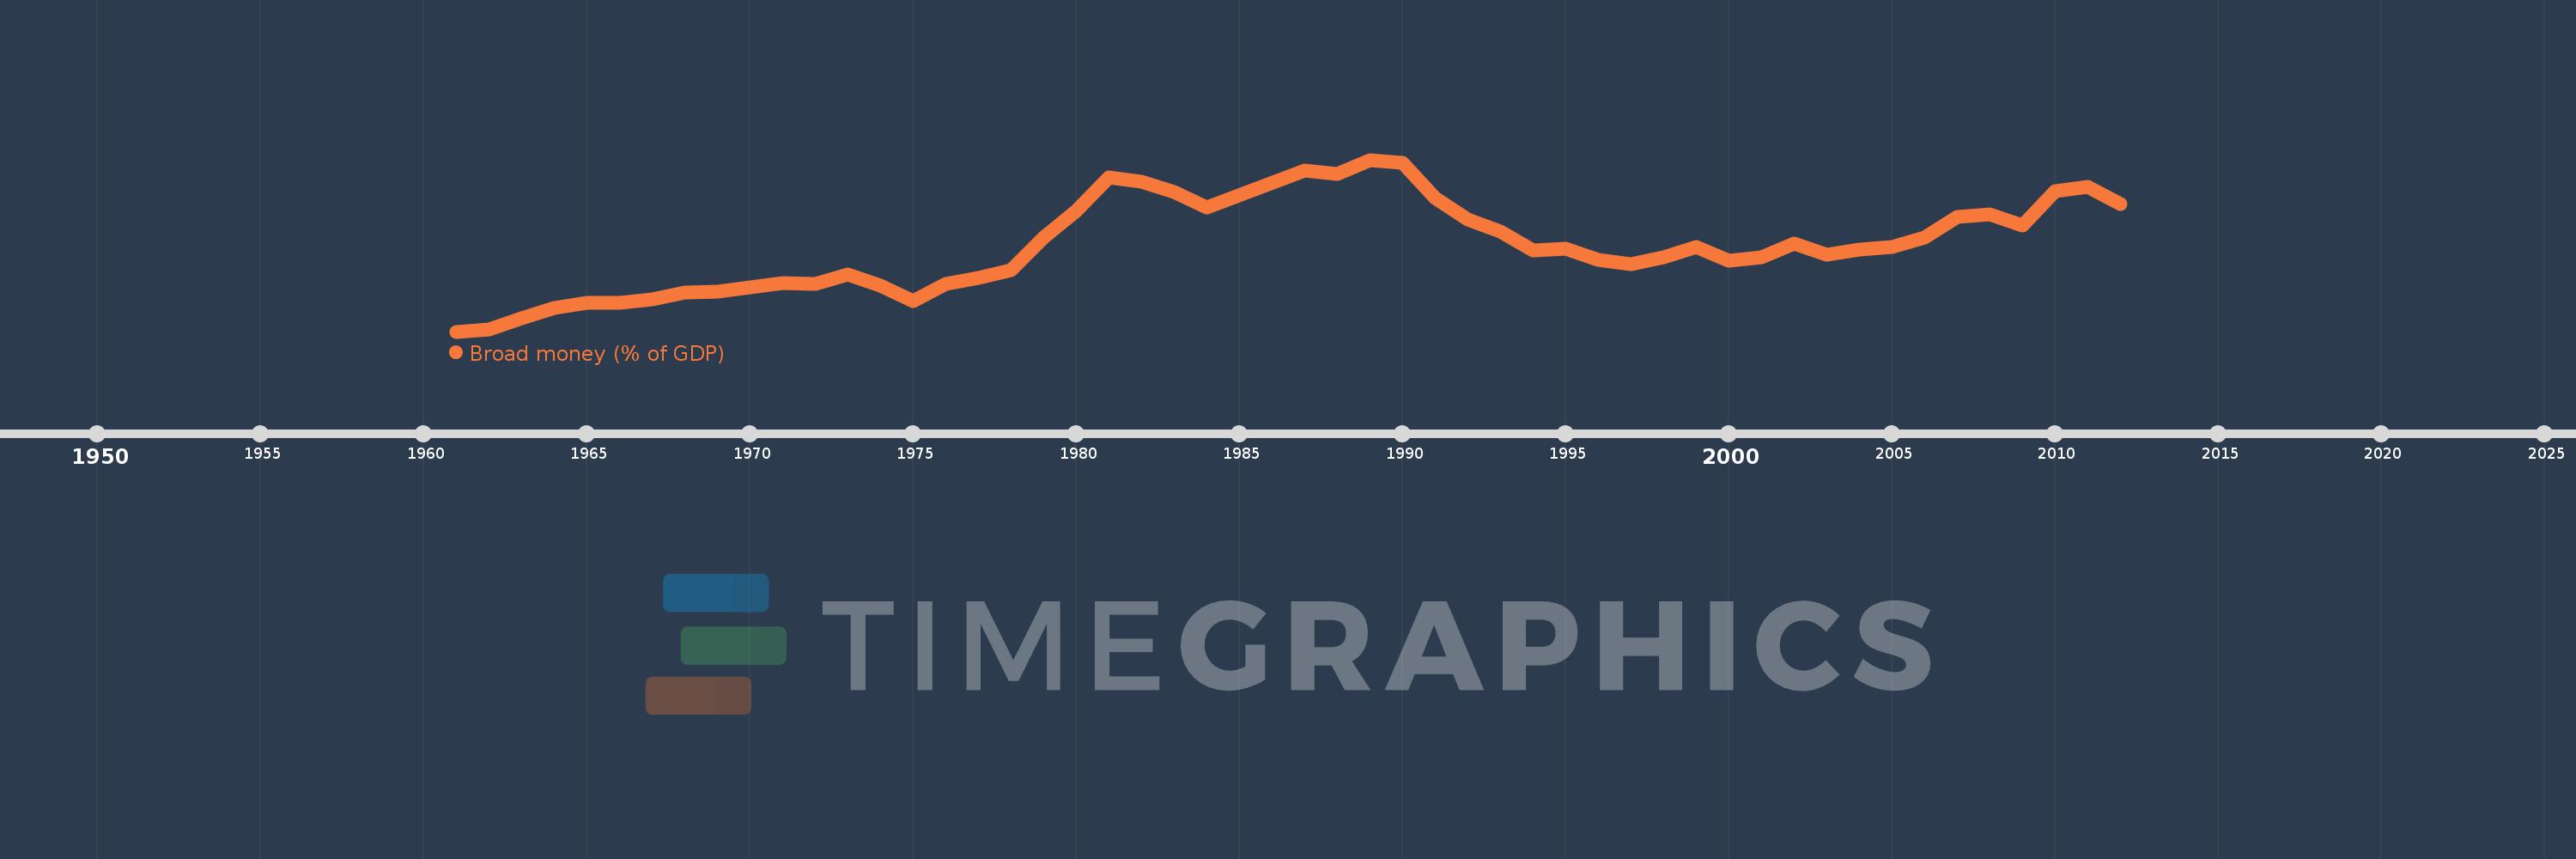
Broad money (% of GDP)
2012,2011,2010,2009,2008,2007,2006,2005,2004,2003,2002,2001,2000,1999,1998,1997,1996,1995,1994,1993,1992,1991,1990,1989,1988,1987,1984,1983,1982,1981,1980,1979,1978,1977,1976,1975,1974,1973,1972,1971,1970,1969,1968,1967,1966,1965,1964,1963,1962,1961
Cette statistique dans les autres pays:
AfghanistanAlbaniaAlgeriaAngolaAntigua and BarbudaArab WorldArgentinaArmeniaArubaAustraliaAzerbaijanBahamas, TheBahrainBangladeshBarbadosBelarusBelizeBeninBhutanBoliviaBosnia and HerzegovinaBotswanaBrazilBrunei DarussalamBulgariaBurkina FasoBurundiCabo VerdeCambodiaCameroonCanadaCaribbean small statesCentral African RepublicCentral Europe and the BalticsChadChileChinaColombiaComorosCongo, Dem. Rep.Congo, Rep.Costa RicaCote d'IvoireCroatiaCzech RepublicDenmarkDjiboutiDominicaDominican RepublicEarly-demographic dividendEast Asia & PacificEast Asia & Pacific (excluding high income)East Asia & Pacific (IDA & IBRD countries)EcuadorEgypt, Arab Rep.El SalvadorEquatorial GuineaEritreaEstoniaEthiopiaEurope & Central Asia (excluding high income)Europe & Central Asia (IDA & IBRD countries)FijiFragile and conflict affected situationsGabonGambia, TheGeorgiaGhanaGrenadaGuatemalaGuineaGuinea-BissauGuyanaHaitiHeavily indebted poor countries (HIPC)High incomeHondurasHong Kong SAR, ChinaHungaryIBRD onlyIcelandIDA & IBRD totalIDA blendIDA onlyIDA totalIndiaIndonesiaIran, Islamic Rep.IraqIsraelJamaicaJapanJordanKazakhstanKenyaKorea, Rep.KuwaitKyrgyz RepublicLao PDRLate-demographic dividendLatin America & Caribbean Latin America & Caribbean (excluding high income)Latin America & the Caribbean (IDA & IBRD countries)LatviaLeast developed countries: UN classificationLebanonLesothoLiberiaLibyaLithuaniaLow & middle incomeLow incomeLower middle incomeMacao SAR, ChinaMacedonia, FYRMadagascarMalawiMalaysiaMaldivesMaliMauritaniaMauritiusMexicoMicronesia, Fed. Sts.Middle East & North AfricaMiddle East & North Africa (excluding high income)Middle East & North Africa (IDA & IBRD countries)Middle incomeMoldovaMongoliaMoroccoMozambiqueMyanmarNamibiaNepalNew ZealandNicaraguaNigerNigeriaNorth AmericaNorwayOECD membersOmanOther small statesPacific island small statesPakistanPanamaPapua New GuineaParaguayPeruPhilippinesPolandPost-demographic dividendPre-demographic dividendQatarRomaniaRussian FederationRwandaSamoaSao Tome and PrincipeSaudi ArabiaSenegalSerbiaSeychellesSierra LeoneSingaporeSlovak RepublicSmall statesSolomon IslandsSouth AfricaSouth AsiaSouth Asia (IDA & IBRD)South SudanSri LankaSt. Kitts and NevisSt. LuciaSt. Vincent and the GrenadinesSub-Saharan Africa Sub-Saharan Africa (excluding high income)Sub-Saharan Africa (IDA & IBRD countries)SudanSurinameSwazilandSwedenSwitzerlandSyrian Arab RepublicTajikistanTanzaniaThailandTimor-LesteTogoTongaTrinidad and TobagoTunisiaTurkeyUgandaUkraineUnited Arab EmiratesUnited KingdomUnited StatesUpper middle incomeUruguayVanuatuVenezuela, RBVietnamWest Bank and GazaWorldYemen, Rep.ZambiaZimbabwe La ligne de temps
Cette échelle de temps montre un graphique de 1961 année à 2012 année Iran, Islamic Rep.. Les données jusqu'à 1960 année ne sont pas présentés. Quantité d'observations actuelles selon dates: 50.
Source (désignation):
Les indicateurs du développement mondiale
Source (organisation):
International Monetary Fund, International Financial Statistics and data files, and World Bank and OECD GDP estimates.
Catégories:
Financial Sector
Dernière mise à jour
23 avr. 2017
Les indicateurs de changement de valeurs selon les années
Minimum:
16.37
1 janv. 1961
Maximum:
64.409
1 janv. 1989
Pour la date d''observation
Valeur
Changement absolu
Le changement par rapport à la valeur précédente
1 janv. 1961
16.37
+16.37
0.0%
1 janv. 1962
17.039
+0.669
4.09%
1 janv. 1963
20.198
+3.158
18.53%
1 janv. 1964
22.955
+2.757
13.65%
1 janv. 1965
24.401
+1.446
6.3%
1 janv. 1966
24.35
-0.051
-0.21%
1 janv. 1967
25.394
+1.044
4.29%
1 janv. 1968
27.191
+1.797
7.08%
1 janv. 1969
27.521
+0.33
1.21%
1 janv. 1970
28.679
+1.157
4.21%
1 janv. 1971
30.029
+1.351
4.71%
1 janv. 1972
29.766
-0.264
-0.88%
1 janv. 1973
32.229
+2.463
8.27%
1 janv. 1974
29.249
-2.98
-9.25%
1 janv. 1975
24.933
-4.315
-14.75%
1 janv. 1976
29.747
+4.814
19.31%
1 janv. 1977
31.472
+1.725
5.8%
1 janv. 1978
33.485
+2.013
6.4%
1 janv. 1979
42.768
+9.283
27.72%
1 janv. 1980
50.019
+7.251
16.95%
1 janv. 1981
59.591
+9.572
19.14%
1 janv. 1982
58.23
-1.362
-2.29%
1 janv. 1983
55.317
-2.912
-5.0%
1 janv. 1984
51.198
-4.119
-7.45%
1 janv. 1987
61.526
+10.328
20.17%
1 janv. 1988
60.482
-1.044
-1.7%
1 janv. 1989
64.409
+3.927
6.49%
1 janv. 1990
63.466
-0.943
-1.46%
1 janv. 1991
53.682
-9.784
-15.42%
1 janv. 1992
47.61
-6.072
-11.31%
1 janv. 1993
44.323
-3.287
-6.9%
1 janv. 1994
39.089
-5.234
-11.81%
1 janv. 1995
39.575
+0.487
1.24%
1 janv. 1996
36.45
-3.126
-7.9%
1 janv. 1997
35.237
-1.212
-3.33%
1 janv. 1998
37.222
+1.984
5.63%
1 janv. 1999
40.131
+2.909
7.82%
1 janv. 2000
36.294
-3.837
-9.56%
1 janv. 2001
37.155
+0.861
2.37%
1 janv. 2002
40.872
+3.717
10.0%
1 janv. 2003
37.856
-3.016
-7.38%
1 janv. 2004
39.197
+1.341
3.54%
1 janv. 2005
40.104
+0.907
2.31%
1 janv. 2006
42.779
+2.675
6.67%
1 janv. 2007
48.46
+5.681
13.28%
1 janv. 2008
49.139
+0.679
1.4%
1 janv. 2009
45.98
-3.159
-6.43%
1 janv. 2010
55.58
+9.599
20.88%
1 janv. 2011
56.811
+1.231
2.22%
1 janv. 2012
52.1
-4.711
-8.29%
Classement des pays selon les statistiques actuelles par années


Commentaires: