29
/fr/
fr
AIzaSyAYiBZKx7MnpbEhh9jyipgxe19OcubqV5w
April 1, 2024
159400
Ireland
IRL
true
2
1
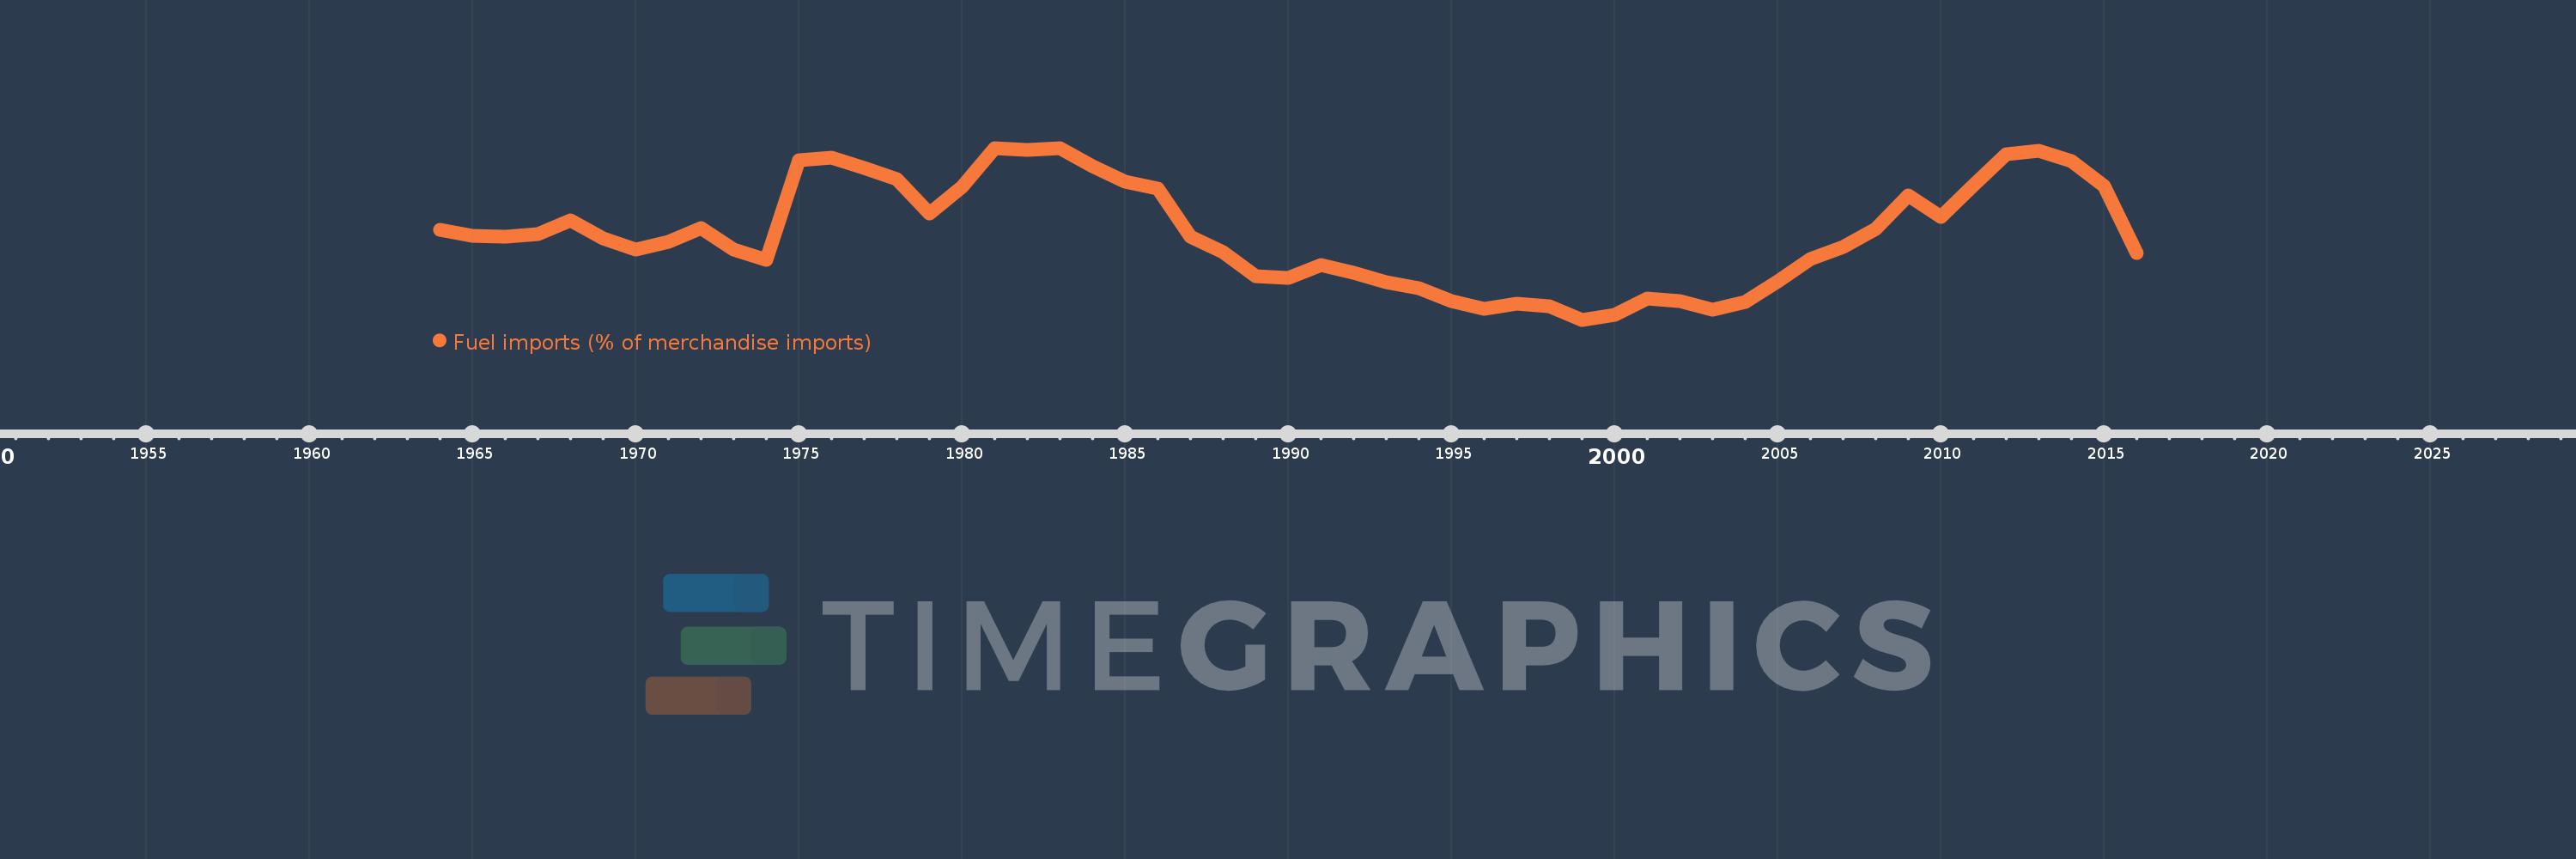
Fuel imports (% of merchandise imports)
2016,2015,2014,2013,2012,2011,2010,2009,2008,2007,2006,2005,2004,2003,2002,2001,2000,1999,1998,1997,1996,1995,1994,1993,1992,1991,1990,1989,1988,1987,1986,1985,1984,1983,1982,1981,1980,1979,1978,1977,1976,1975,1974,1973,1972,1971,1970,1969,1968,1967,1966,1965,1964
Cette statistique dans les autres pays:
AfghanistanAlbaniaAlgeriaAndorraAngolaAntigua and BarbudaArab WorldArgentinaArmeniaArubaAustraliaAustriaAzerbaijanBahamas, TheBahrainBangladeshBarbadosBelarusBelgiumBelizeBeninBermudaBhutanBoliviaBosnia and HerzegovinaBotswanaBrazilBrunei DarussalamBulgariaBurkina FasoBurundiCabo VerdeCambodiaCameroonCanadaCaribbean small statesCayman IslandsCentral African RepublicCentral Europe and the BalticsChadChileChinaColombiaComorosCongo, Dem. Rep.Congo, Rep.Costa RicaCote d'IvoireCroatiaCubaCyprusCzech RepublicDenmarkDjiboutiDominicaDominican RepublicEarly-demographic dividendEast Asia & PacificEast Asia & Pacific (excluding high income)East Asia & Pacific (IDA & IBRD countries)EcuadorEgypt, Arab Rep.El SalvadorEquatorial GuineaEritreaEstoniaEthiopiaEuro areaEurope & Central AsiaEurope & Central Asia (excluding high income)Europe & Central Asia (IDA & IBRD countries)European UnionFaroe IslandsFijiFinlandFragile and conflict affected situationsFranceFrench PolynesiaGabonGambia, TheGeorgiaGermanyGhanaGreeceGreenlandGrenadaGuatemalaGuineaGuinea-BissauGuyanaHaitiHeavily indebted poor countries (HIPC)High incomeHondurasHong Kong SAR, ChinaHungaryIBRD onlyIcelandIDA & IBRD totalIDA blendIDA onlyIDA totalIndiaIndonesiaIran, Islamic Rep.IraqIrelandIsraelItalyJamaicaJapanJordanKazakhstanKenyaKiribatiKorea, Rep.KuwaitKyrgyz RepublicLao PDRLate-demographic dividendLatin America & Caribbean Latin America & Caribbean (excluding high income)Latin America & the Caribbean (IDA & IBRD countries)LatviaLeast developed countries: UN classificationLebanonLesothoLiberiaLibyaLithuaniaLow & middle incomeLow incomeLower middle incomeLuxembourgMacao SAR, ChinaMacedonia, FYRMadagascarMalawiMalaysiaMaldivesMaliMaltaMauritaniaMauritiusMexicoMiddle East & North AfricaMiddle East & North Africa (excluding high income)Middle East & North Africa (IDA & IBRD countries)Middle incomeMoldovaMongoliaMoroccoMozambiqueMyanmarNamibiaNepalNetherlandsNew CaledoniaNew ZealandNicaraguaNigerNigeriaNorth AmericaNorwayOECD membersOmanOther small statesPacific island small statesPakistanPalauPanamaPapua New GuineaParaguayPeruPhilippinesPolandPortugalPost-demographic dividendPre-demographic dividendQatarRomaniaRussian FederationRwandaSamoaSao Tome and PrincipeSaudi ArabiaSenegalSerbiaSeychellesSierra LeoneSingaporeSlovak RepublicSloveniaSmall statesSolomon IslandsSomaliaSouth AfricaSouth AsiaSouth Asia (IDA & IBRD)SpainSri LankaSt. Kitts and NevisSt. LuciaSt. Vincent and the GrenadinesSub-Saharan Africa Sub-Saharan Africa (excluding high income)Sub-Saharan Africa (IDA & IBRD countries)SudanSurinameSwazilandSwedenSwitzerlandSyrian Arab RepublicTajikistanTanzaniaThailandTimor-LesteTogoTongaTrinidad and TobagoTunisiaTurkeyTurkmenistanTurks and Caicos IslandsTuvaluUgandaUkraineUnited Arab EmiratesUnited KingdomUnited StatesUpper middle incomeUruguayVanuatuVenezuela, RBVietnamVirgin Islands (U.S.)WorldYemen, Rep.ZambiaZimbabwe La ligne de temps
Cette échelle de temps montre un graphique de 1964 année à 2016 année Ireland. Les données jusqu'à 1963 année ne sont pas présentés. Quantité d'observations actuelles selon dates: 53.
Source (désignation):
Les indicateurs du développement mondiale
Source (organisation):
World Bank staff estimates from the Comtrade database maintained by the United Nations Statistics Division.
Catégories:
Energy & Mining, Private Sector, Trade
Dernière mise à jour
23 avr. 2017
Les indicateurs de changement de valeurs selon les années
Minimum:
2.557
1 janv. 1999
Maximum:
14.798
1 janv. 1983
Pour la date d''observation
Valeur
Changement absolu
Le changement par rapport à la valeur précédente
1 janv. 1964
8.936
+8.936
0.0%
1 janv. 1965
8.516
-0.42
-4.7%
1 janv. 1966
8.449
-0.066
-0.78%
1 janv. 1967
8.649
+0.2
2.36%
1 janv. 1968
9.614
+0.965
11.16%
1 janv. 1969
8.361
-1.253
-13.03%
1 janv. 1970
7.579
-0.782
-9.36%
1 janv. 1971
8.091
+0.512
6.76%
1 janv. 1972
9.059
+0.968
11.96%
1 janv. 1973
7.534
-1.525
-16.83%
1 janv. 1974
6.796
-0.738
-9.8%
1 janv. 1975
13.912
+7.116
104.72%
1 janv. 1976
14.09
+0.178
1.28%
1 janv. 1977
13.398
-0.692
-4.91%
1 janv. 1978
12.596
-0.802
-5.99%
1 janv. 1979
10.108
-2.488
-19.75%
1 janv. 1980
12.049
+1.941
19.2%
1 janv. 1981
14.793
+2.744
22.77%
1 janv. 1982
14.682
-0.11
-0.75%
1 janv. 1983
14.798
+0.116
0.79%
1 janv. 1984
13.489
-1.309
-8.85%
1 janv. 1985
12.409
-1.08
-8.01%
1 janv. 1986
11.893
-0.516
-4.16%
1 janv. 1987
8.487
-3.406
-28.64%
1 janv. 1988
7.382
-1.104
-13.01%
1 janv. 1989
5.675
-1.708
-23.13%
1 janv. 1990
5.522
-0.153
-2.69%
1 janv. 1991
6.464
+0.942
17.06%
1 janv. 1992
5.902
-0.562
-8.7%
1 janv. 1993
5.229
-0.673
-11.4%
1 janv. 1994
4.802
-0.427
-8.16%
1 janv. 1995
3.875
-0.927
-19.3%
1 janv. 1996
3.308
-0.567
-14.64%
1 janv. 1997
3.705
+0.397
12.0%
1 janv. 1998
3.491
-0.214
-5.77%
1 janv. 1999
2.557
-0.934
-26.76%
1 janv. 2000
2.936
+0.379
14.82%
1 janv. 2001
4.08
+1.144
38.96%
1 janv. 2002
3.871
-0.208
-5.11%
1 janv. 2003
3.255
-0.616
-15.91%
1 janv. 2004
3.82
+0.564
17.34%
1 janv. 2005
5.279
+1.459
38.2%
1 janv. 2006
6.874
+1.595
30.22%
1 janv. 2007
7.761
+0.887
12.9%
1 janv. 2008
9.018
+1.257
16.2%
1 janv. 2009
11.434
+2.416
26.79%
1 janv. 2010
9.858
-1.576
-13.79%
1 janv. 2011
12.173
+2.315
23.48%
1 janv. 2012
14.37
+2.197
18.05%
1 janv. 2013
14.583
+0.213
1.48%
1 janv. 2014
13.892
-0.691
-4.74%
1 janv. 2015
12.101
-1.791
-12.89%
1 janv. 2016
7.295
-4.806
-39.72%
Classement des pays selon les statistiques actuelles par années


Commentaires: