29
/fr/
fr
AIzaSyAYiBZKx7MnpbEhh9jyipgxe19OcubqV5w
April 1, 2024
124792
Egypt, Arab Rep.
EGY
true
2
1
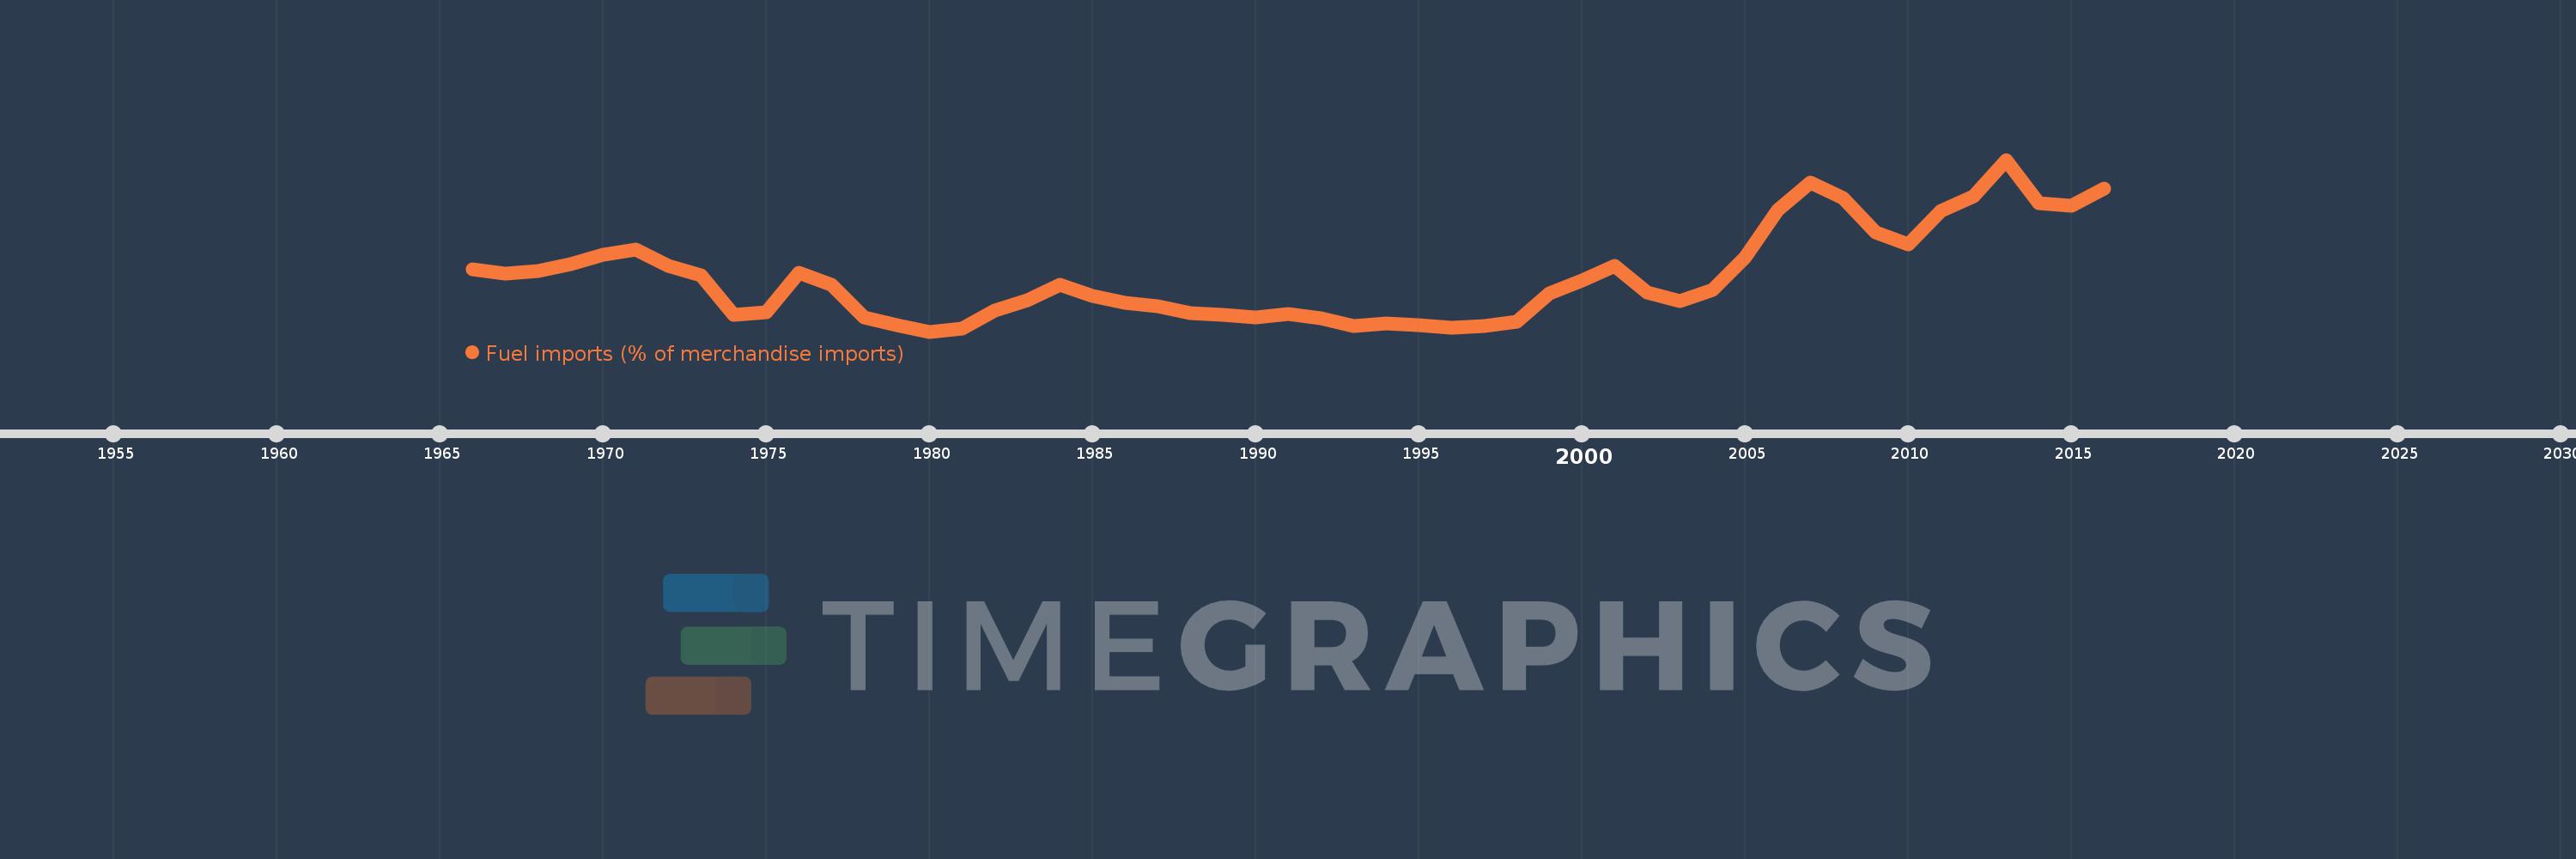
Fuel imports (% of merchandise imports)
2016,2015,2014,2013,2012,2011,2010,2009,2008,2007,2006,2005,2004,2003,2002,2001,2000,1999,1998,1997,1996,1995,1994,1993,1992,1991,1990,1989,1988,1987,1986,1985,1984,1983,1982,1981,1980,1979,1978,1977,1976,1975,1974,1973,1972,1971,1970,1969,1968,1967,1966
Cette statistique dans les autres pays:
AfghanistanAlbaniaAlgeriaAndorraAngolaAntigua and BarbudaArab WorldArgentinaArmeniaArubaAustraliaAustriaAzerbaijanBahamas, TheBahrainBangladeshBarbadosBelarusBelgiumBelizeBeninBermudaBhutanBoliviaBosnia and HerzegovinaBotswanaBrazilBrunei DarussalamBulgariaBurkina FasoBurundiCabo VerdeCambodiaCameroonCanadaCaribbean small statesCayman IslandsCentral African RepublicCentral Europe and the BalticsChadChileChinaColombiaComorosCongo, Dem. Rep.Congo, Rep.Costa RicaCote d'IvoireCroatiaCubaCyprusCzech RepublicDenmarkDjiboutiDominicaDominican RepublicEarly-demographic dividendEast Asia & PacificEast Asia & Pacific (excluding high income)East Asia & Pacific (IDA & IBRD countries)EcuadorEgypt, Arab Rep.El SalvadorEquatorial GuineaEritreaEstoniaEthiopiaEuro areaEurope & Central AsiaEurope & Central Asia (excluding high income)Europe & Central Asia (IDA & IBRD countries)European UnionFaroe IslandsFijiFinlandFragile and conflict affected situationsFranceFrench PolynesiaGabonGambia, TheGeorgiaGermanyGhanaGreeceGreenlandGrenadaGuatemalaGuineaGuinea-BissauGuyanaHaitiHeavily indebted poor countries (HIPC)High incomeHondurasHong Kong SAR, ChinaHungaryIBRD onlyIcelandIDA & IBRD totalIDA blendIDA onlyIDA totalIndiaIndonesiaIran, Islamic Rep.IraqIrelandIsraelItalyJamaicaJapanJordanKazakhstanKenyaKiribatiKorea, Rep.KuwaitKyrgyz RepublicLao PDRLate-demographic dividendLatin America & Caribbean Latin America & Caribbean (excluding high income)Latin America & the Caribbean (IDA & IBRD countries)LatviaLeast developed countries: UN classificationLebanonLesothoLiberiaLibyaLithuaniaLow & middle incomeLow incomeLower middle incomeLuxembourgMacao SAR, ChinaMacedonia, FYRMadagascarMalawiMalaysiaMaldivesMaliMaltaMauritaniaMauritiusMexicoMiddle East & North AfricaMiddle East & North Africa (excluding high income)Middle East & North Africa (IDA & IBRD countries)Middle incomeMoldovaMongoliaMoroccoMozambiqueMyanmarNamibiaNepalNetherlandsNew CaledoniaNew ZealandNicaraguaNigerNigeriaNorth AmericaNorwayOECD membersOmanOther small statesPacific island small statesPakistanPalauPanamaPapua New GuineaParaguayPeruPhilippinesPolandPortugalPost-demographic dividendPre-demographic dividendQatarRomaniaRussian FederationRwandaSamoaSao Tome and PrincipeSaudi ArabiaSenegalSerbiaSeychellesSierra LeoneSingaporeSlovak RepublicSloveniaSmall statesSolomon IslandsSomaliaSouth AfricaSouth AsiaSouth Asia (IDA & IBRD)SpainSri LankaSt. Kitts and NevisSt. LuciaSt. Vincent and the GrenadinesSub-Saharan Africa Sub-Saharan Africa (excluding high income)Sub-Saharan Africa (IDA & IBRD countries)SudanSurinameSwazilandSwedenSwitzerlandSyrian Arab RepublicTajikistanTanzaniaThailandTimor-LesteTogoTongaTrinidad and TobagoTunisiaTurkeyTurkmenistanTurks and Caicos IslandsTuvaluUgandaUkraineUnited Arab EmiratesUnited KingdomUnited StatesUpper middle incomeUruguayVanuatuVenezuela, RBVietnamVirgin Islands (U.S.)WorldYemen, Rep.ZambiaZimbabwe La ligne de temps
Cette échelle de temps montre un graphique de 1966 année à 2016 année Egypt, Arab Rep.. Les données jusqu'à 1965 année ne sont pas présentés. Quantité d'observations actuelles selon dates: 51.
Source (désignation):
Les indicateurs du développement mondiale
Source (organisation):
World Bank staff estimates from the Comtrade database maintained by the United Nations Statistics Division.
Catégories:
Energy & Mining, Private Sector, Trade
Dernière mise à jour
23 avr. 2017
Les indicateurs de changement de valeurs selon les années
Maximum:
18.741
1 janv. 2013
Pour la date d''observation
Valeur
Changement absolu
Le changement par rapport à la valeur précédente
1 janv. 1966
7.353
+7.353
0.0%
1 janv. 1967
6.876
-0.476
-6.48%
1 janv. 1968
7.113
+0.237
3.44%
1 janv. 1969
7.837
+0.724
10.18%
1 janv. 1970
8.859
+1.022
13.05%
1 janv. 1971
9.39
+0.531
5.99%
1 janv. 1972
7.682
-1.708
-18.19%
1 janv. 1973
6.653
-1.03
-13.41%
1 janv. 1974
2.602
-4.05
-60.88%
1 janv. 1975
2.79
+0.188
7.23%
1 janv. 1976
6.925
+4.135
148.17%
1 janv. 1977
5.735
-1.19
-17.19%
1 janv. 1978
2.266
-3.468
-60.48%
1 janv. 1979
1.499
-0.767
-33.86%
1 janv. 1980
0.81
-0.689
-45.96%
1 janv. 1981
1.085
+0.275
33.98%
1 janv. 1982
2.999
+1.913
176.31%
1 janv. 1983
4.092
+1.093
36.47%
1 janv. 1984
5.685
+1.593
38.92%
1 janv. 1985
4.496
-1.189
-20.92%
1 janv. 1986
3.779
-0.717
-15.95%
1 janv. 1987
3.414
-0.365
-9.66%
1 janv. 1988
2.772
-0.641
-18.79%
1 janv. 1989
2.544
-0.229
-8.25%
1 janv. 1990
2.303
-0.241
-9.48%
1 janv. 1991
2.649
+0.347
15.06%
1 janv. 1992
2.212
-0.437
-16.49%
1 janv. 1993
1.379
-0.833
-37.65%
1 janv. 1994
1.668
+0.289
20.94%
1 janv. 1995
1.438
-0.23
-13.79%
1 janv. 1996
1.228
-0.21
-14.6%
1 janv. 1997
1.43
+0.202
16.44%
1 janv. 1998
1.801
+0.371
25.91%
1 janv. 1999
4.823
+3.022
167.82%
1 janv. 2000
6.131
+1.308
27.12%
1 janv. 2001
7.652
+1.521
24.82%
1 janv. 2002
4.932
-2.72
-35.55%
1 janv. 2003
4.016
-0.916
-18.57%
1 janv. 2004
5.181
+1.165
29.0%
1 janv. 2005
8.597
+3.416
65.93%
1 janv. 2006
13.531
+4.934
57.39%
1 janv. 2007
16.359
+2.827
20.9%
1 janv. 2008
14.759
-1.6
-9.78%
1 janv. 2009
11.123
-3.636
-24.63%
1 janv. 2010
9.896
-1.227
-11.03%
1 janv. 2011
13.443
+3.547
35.84%
1 janv. 2012
14.911
+1.468
10.92%
1 janv. 2013
18.741
+3.83
25.69%
1 janv. 2014
14.179
-4.563
-24.35%
1 janv. 2015
13.962
-0.216
-1.53%
1 janv. 2016
15.749
+1.787
12.8%
Classement des pays selon les statistiques actuelles par années


Commentaires: