29
/fr/
fr
AIzaSyAYiBZKx7MnpbEhh9jyipgxe19OcubqV5w
April 1, 2024
151508
Hong Kong SAR, China
HKG
true
2
1
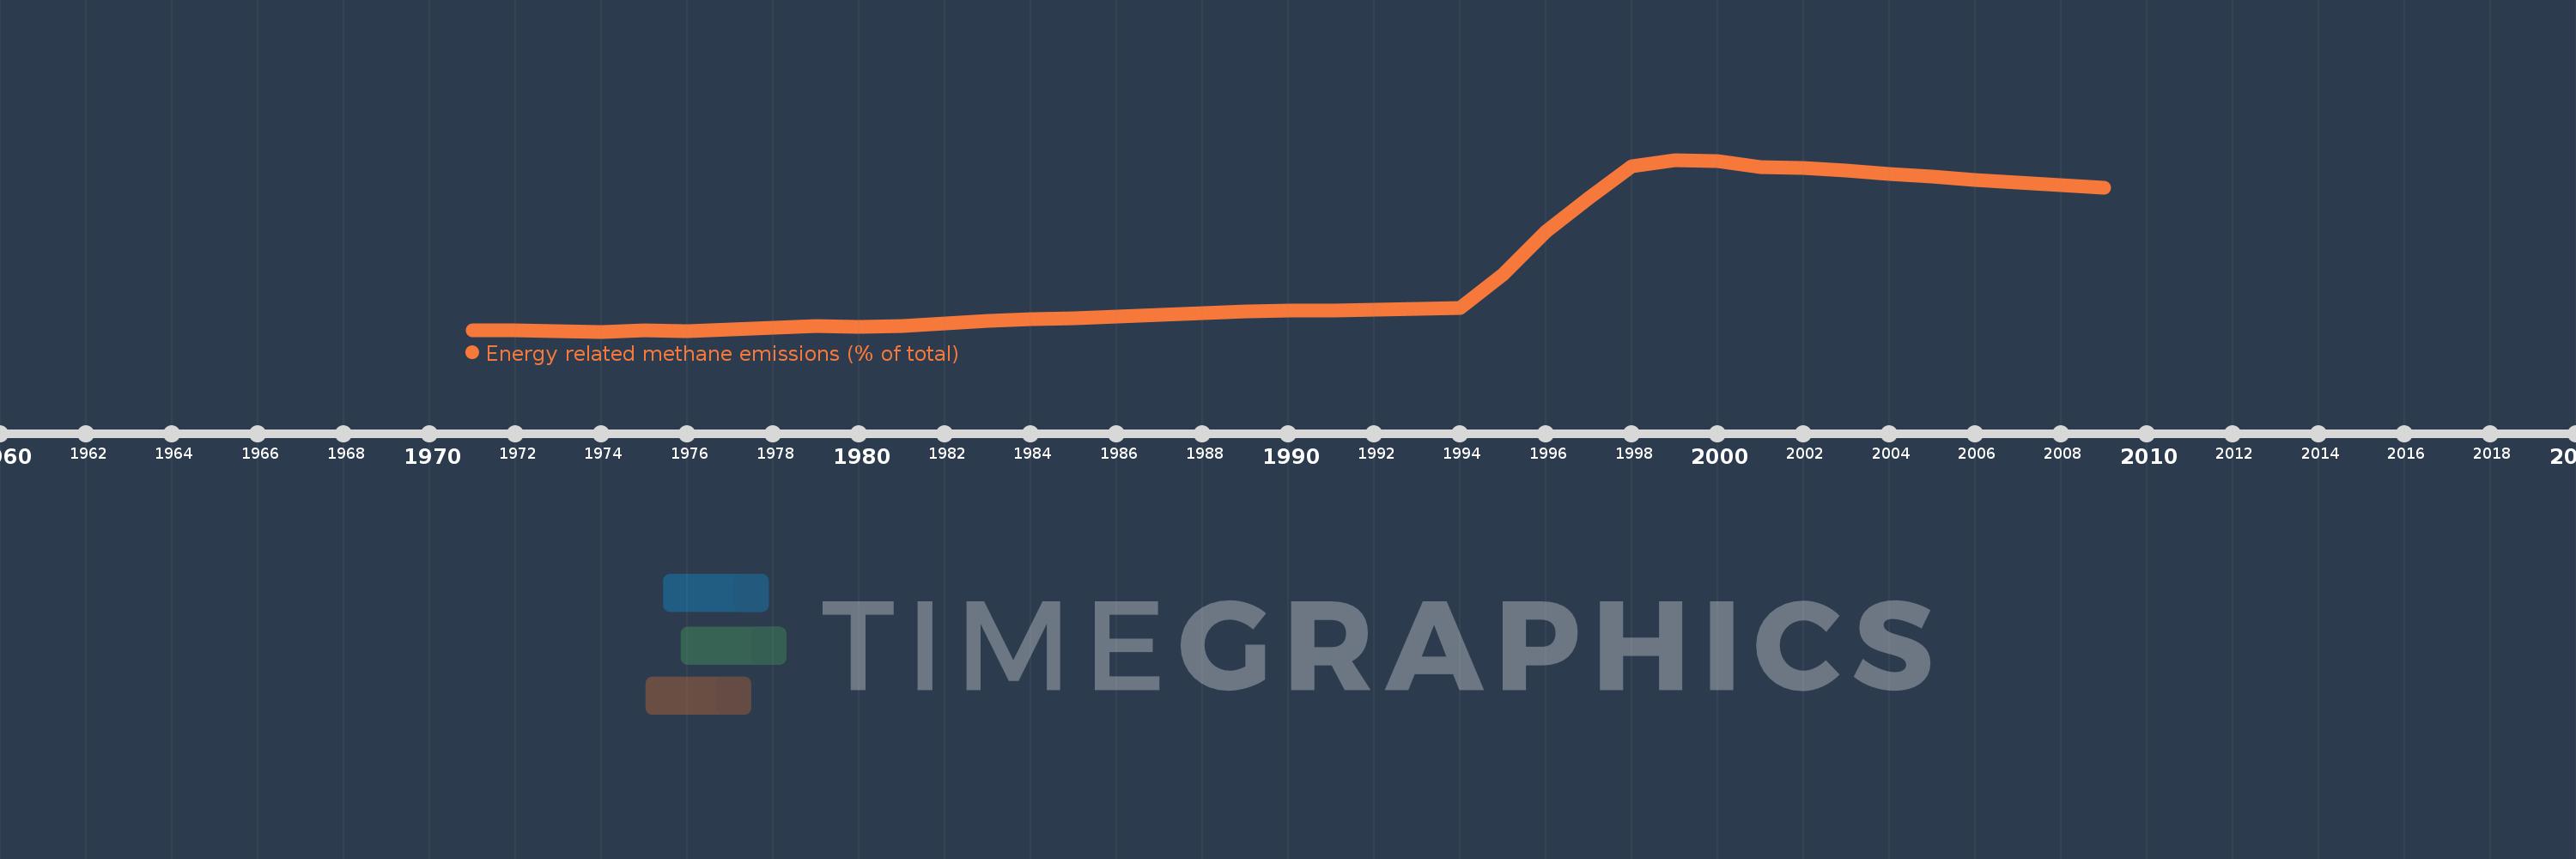
Energy related methane emissions (% of total)
2009,2008,2007,2006,2005,2004,2003,2002,2001,2000,1999,1998,1997,1996,1995,1994,1993,1992,1991,1990,1989,1988,1987,1986,1985,1984,1983,1982,1981,1980,1979,1978,1977,1976,1975,1974,1973,1972,1971
Cette statistique dans les autres pays:
AfghanistanAlbaniaAlgeriaAmerican SamoaAngolaAntigua and BarbudaArab WorldArgentinaArmeniaArubaAustraliaAustriaAzerbaijanBahamas, TheBahrainBangladeshBarbadosBelarusBelgiumBelizeBeninBermudaBhutanBoliviaBosnia and HerzegovinaBotswanaBrazilBritish Virgin IslandsBrunei DarussalamBulgariaBurkina FasoBurundiCabo VerdeCambodiaCameroonCanadaCaribbean small statesCayman IslandsCentral African RepublicCentral Europe and the BalticsChadChileChinaColombiaComorosCongo, Dem. Rep.Congo, Rep.Costa RicaCote d'IvoireCroatiaCubaCyprusCzech RepublicDenmarkDjiboutiDominicaDominican RepublicEarly-demographic dividendEast Asia & PacificEast Asia & Pacific (excluding high income)East Asia & Pacific (IDA & IBRD countries)EcuadorEgypt, Arab Rep.El SalvadorEquatorial GuineaEritreaEstoniaEthiopiaEuro areaEurope & Central AsiaEurope & Central Asia (excluding high income)Europe & Central Asia (IDA & IBRD countries)European UnionFaroe IslandsFijiFinlandFragile and conflict affected situationsFranceFrench PolynesiaGabonGambia, TheGeorgiaGermanyGhanaGibraltarGreeceGreenlandGrenadaGuamGuatemalaGuineaGuinea-BissauGuyanaHaitiHeavily indebted poor countries (HIPC)High incomeHondurasHong Kong SAR, ChinaHungaryIBRD onlyIcelandIDA & IBRD totalIDA blendIDA onlyIDA totalIndiaIndonesiaIran, Islamic Rep.IraqIrelandIsraelItalyJamaicaJapanJordanKazakhstanKenyaKiribatiKorea, Dem. People’s Rep.Korea, Rep.KuwaitKyrgyz RepublicLao PDRLate-demographic dividendLatin America & Caribbean Latin America & Caribbean (excluding high income)Latin America & the Caribbean (IDA & IBRD countries)LatviaLeast developed countries: UN classificationLebanonLesothoLiberiaLibyaLithuaniaLow & middle incomeLow incomeLower middle incomeLuxembourgMacao SAR, ChinaMacedonia, FYRMadagascarMalawiMalaysiaMaldivesMaliMaltaMarshall IslandsMauritaniaMauritiusMexicoMicronesia, Fed. Sts.Middle East & North AfricaMiddle East & North Africa (excluding high income)Middle East & North Africa (IDA & IBRD countries)Middle incomeMoldovaMongoliaMoroccoMozambiqueMyanmarNamibiaNauruNepalNetherlandsNew CaledoniaNew ZealandNicaraguaNigerNigeriaNorth AmericaNorthern Mariana IslandsNorwayOECD membersOmanOther small statesPacific island small statesPakistanPalauPanamaPapua New GuineaParaguayPeruPhilippinesPolandPortugalPost-demographic dividendPre-demographic dividendPuerto RicoQatarRomaniaRussian FederationRwandaSamoaSao Tome and PrincipeSaudi ArabiaSenegalSerbiaSeychellesSierra LeoneSingaporeSlovak RepublicSloveniaSmall statesSolomon IslandsSomaliaSouth AfricaSouth AsiaSouth Asia (IDA & IBRD)SpainSri LankaSt. Kitts and NevisSt. LuciaSt. Vincent and the GrenadinesSub-Saharan Africa Sub-Saharan Africa (excluding high income)Sub-Saharan Africa (IDA & IBRD countries)SudanSurinameSwazilandSwedenSwitzerlandSyrian Arab RepublicTajikistanTanzaniaThailandTimor-LesteTogoTongaTrinidad and TobagoTunisiaTurkeyTurkmenistanTurks and Caicos IslandsTuvaluUgandaUkraineUnited Arab EmiratesUnited KingdomUnited StatesUpper middle incomeUruguayUzbekistanVanuatuVenezuela, RBVietnamVirgin Islands (U.S.)WorldYemen, Rep.ZambiaZimbabwe La ligne de temps
Cette échelle de temps montre un graphique de 1971 année à 2009 année Hong Kong SAR, China. Les données jusqu'à 1970 année ne sont pas présentés. Quantité d'observations actuelles selon dates: 39.
Source (désignation):
Les indicateurs du développement mondiale
Source (organisation):
World Bank staff estimates from original source: European Commission, Joint Research Centre (JRC)/Netherlands Environmental Assessment Agency (PBL). Emission Database for Global Atmospheric Research (EDGAR): http://edgar.jrc.ec.europa.eu/.
Catégories:
Energy & Mining, Environment
Dernière mise à jour
23 avr. 2017
Les indicateurs de changement de valeurs selon les années
Minimum:
2.718
1 janv. 1974
Maximum:
30.033
1 janv. 1999
Pour la date d''observation
Valeur
Changement absolu
Le changement par rapport à la valeur précédente
1 janv. 1971
2.925
+2.925
0.0%
1 janv. 1972
2.874
-0.051
-1.75%
1 janv. 1973
2.733
-0.141
-4.91%
1 janv. 1974
2.718
-0.015
-0.56%
1 janv. 1975
2.901
+0.184
6.76%
1 janv. 1976
2.739
-0.163
-5.6%
1 janv. 1977
3.045
+0.306
11.17%
1 janv. 1978
3.391
+0.346
11.38%
1 janv. 1979
3.545
+0.154
4.54%
1 janv. 1980
3.494
-0.051
-1.44%
1 janv. 1981
3.669
+0.175
5.0%
1 janv. 1982
4.069
+0.4
10.9%
1 janv. 1983
4.45
+0.381
9.36%
1 janv. 1984
4.715
+0.266
5.97%
1 janv. 1985
4.9
+0.184
3.91%
1 janv. 1986
5.086
+0.186
3.8%
1 janv. 1987
5.421
+0.335
6.59%
1 janv. 1988
5.681
+0.26
4.8%
1 janv. 1989
5.983
+0.301
5.31%
1 janv. 1990
6.0
+0.018
0.3%
1 janv. 1991
6.021
+0.021
0.34%
1 janv. 1992
6.139
+0.118
1.96%
1 janv. 1993
6.365
+0.226
3.69%
1 janv. 1994
6.421
+0.056
0.88%
1 janv. 1995
11.755
+5.333
83.06%
1 janv. 1996
18.609
+6.855
58.31%
1 janv. 1997
23.988
+5.378
28.9%
1 janv. 1998
29.019
+5.032
20.98%
1 janv. 1999
30.033
+1.014
3.49%
1 janv. 2000
29.859
-0.174
-0.58%
1 janv. 2001
28.89
-0.969
-3.25%
1 janv. 2002
28.763
-0.127
-0.44%
1 janv. 2003
28.261
-0.502
-1.74%
1 janv. 2004
27.739
-0.522
-1.85%
1 janv. 2005
27.362
-0.377
-1.36%
1 janv. 2006
26.797
-0.566
-2.07%
1 janv. 2007
26.467
-0.329
-1.23%
1 janv. 2008
26.008
-0.459
-1.73%
1 janv. 2009
25.554
-0.454
-1.75%
Classement des pays selon les statistiques actuelles par années


Commentaires: