29
/fr/
fr
AIzaSyAYiBZKx7MnpbEhh9jyipgxe19OcubqV5w
April 1, 2024
147868
Guyana
GUY
true
2
1
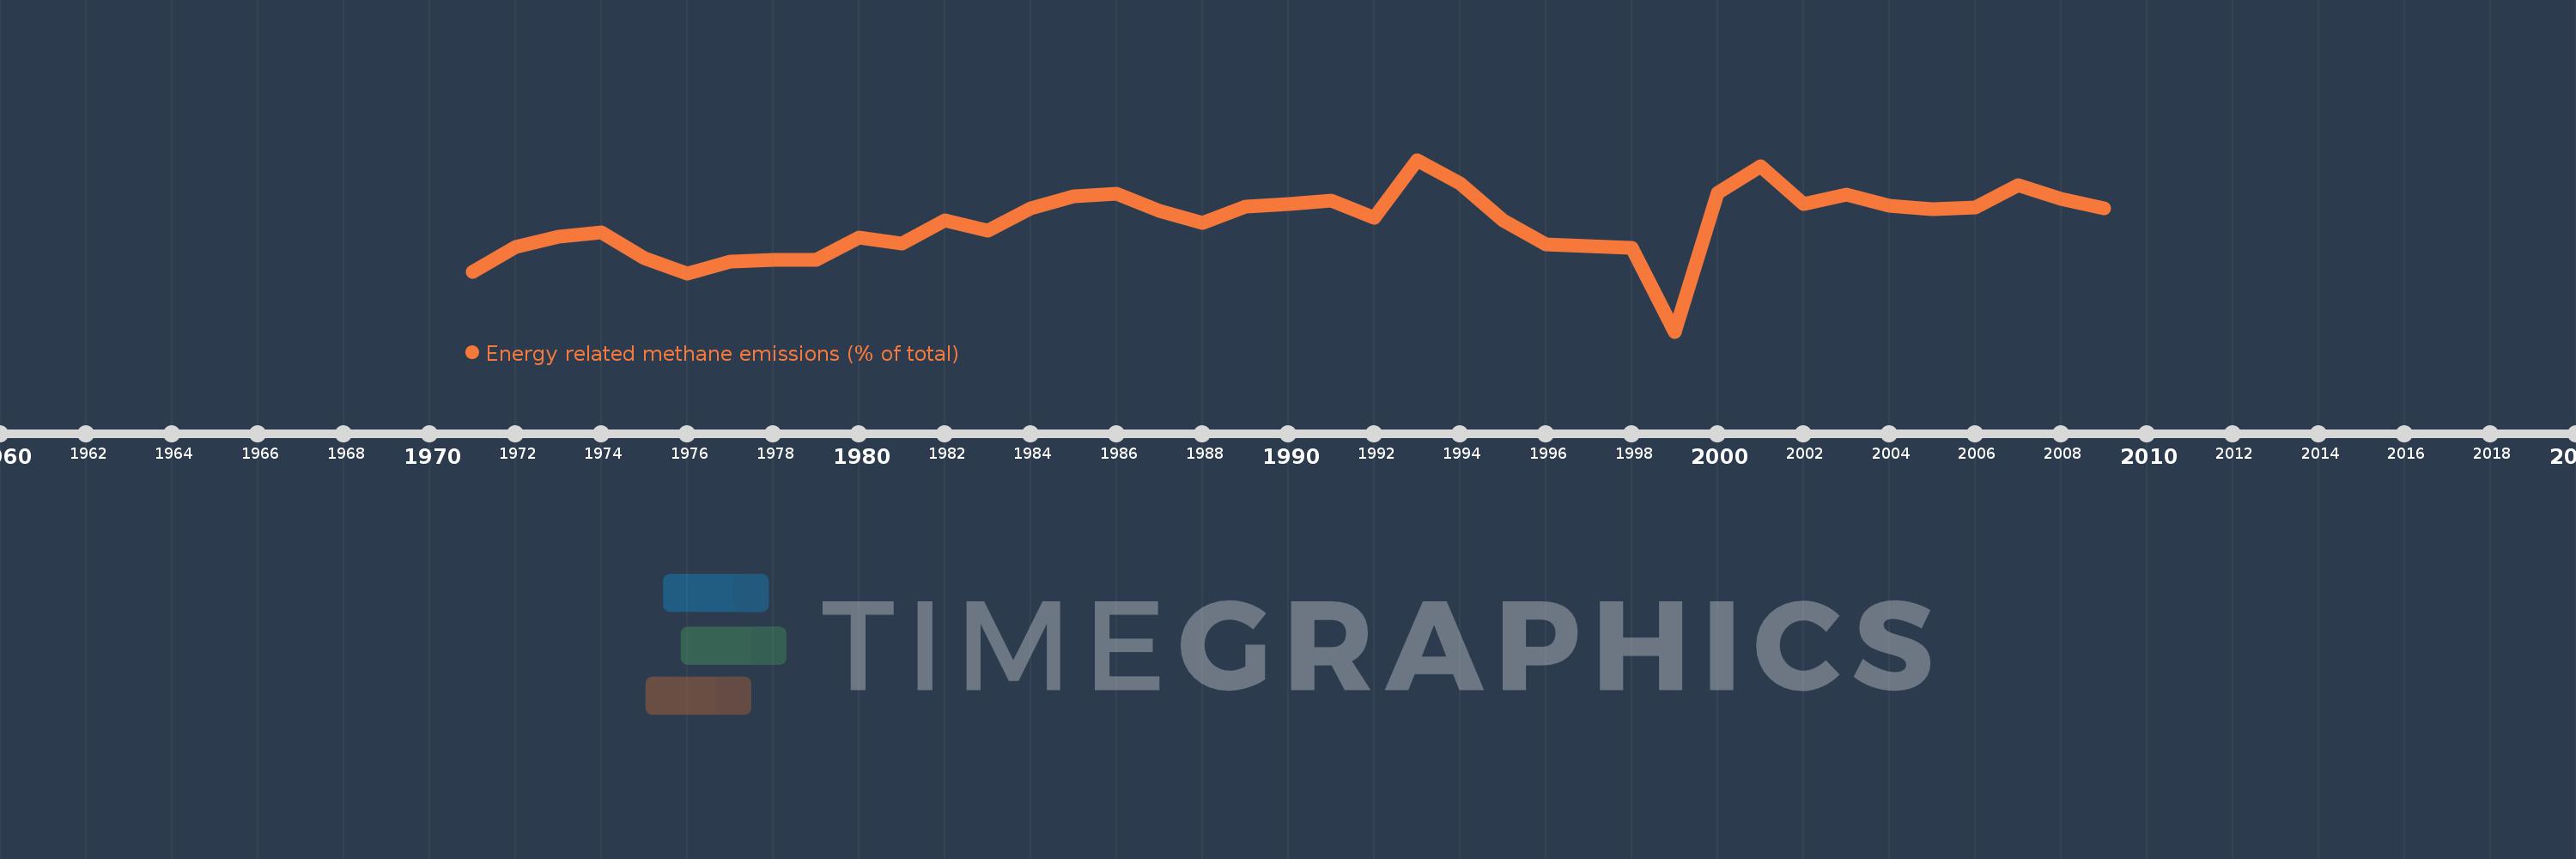
Energy related methane emissions (% of total)
2009,2008,2007,2006,2005,2004,2003,2002,2001,2000,1999,1998,1997,1996,1995,1994,1993,1992,1991,1990,1989,1988,1987,1986,1985,1984,1983,1982,1981,1980,1979,1978,1977,1976,1975,1974,1973,1972,1971
Cette statistique dans les autres pays:
AfghanistanAlbaniaAlgeriaAmerican SamoaAngolaAntigua and BarbudaArab WorldArgentinaArmeniaArubaAustraliaAustriaAzerbaijanBahamas, TheBahrainBangladeshBarbadosBelarusBelgiumBelizeBeninBermudaBhutanBoliviaBosnia and HerzegovinaBotswanaBrazilBritish Virgin IslandsBrunei DarussalamBulgariaBurkina FasoBurundiCabo VerdeCambodiaCameroonCanadaCaribbean small statesCayman IslandsCentral African RepublicCentral Europe and the BalticsChadChileChinaColombiaComorosCongo, Dem. Rep.Congo, Rep.Costa RicaCote d'IvoireCroatiaCubaCyprusCzech RepublicDenmarkDjiboutiDominicaDominican RepublicEarly-demographic dividendEast Asia & PacificEast Asia & Pacific (excluding high income)East Asia & Pacific (IDA & IBRD countries)EcuadorEgypt, Arab Rep.El SalvadorEquatorial GuineaEritreaEstoniaEthiopiaEuro areaEurope & Central AsiaEurope & Central Asia (excluding high income)Europe & Central Asia (IDA & IBRD countries)European UnionFaroe IslandsFijiFinlandFragile and conflict affected situationsFranceFrench PolynesiaGabonGambia, TheGeorgiaGermanyGhanaGibraltarGreeceGreenlandGrenadaGuamGuatemalaGuineaGuinea-BissauGuyanaHaitiHeavily indebted poor countries (HIPC)High incomeHondurasHong Kong SAR, ChinaHungaryIBRD onlyIcelandIDA & IBRD totalIDA blendIDA onlyIDA totalIndiaIndonesiaIran, Islamic Rep.IraqIrelandIsraelItalyJamaicaJapanJordanKazakhstanKenyaKiribatiKorea, Dem. People’s Rep.Korea, Rep.KuwaitKyrgyz RepublicLao PDRLate-demographic dividendLatin America & Caribbean Latin America & Caribbean (excluding high income)Latin America & the Caribbean (IDA & IBRD countries)LatviaLeast developed countries: UN classificationLebanonLesothoLiberiaLibyaLithuaniaLow & middle incomeLow incomeLower middle incomeLuxembourgMacao SAR, ChinaMacedonia, FYRMadagascarMalawiMalaysiaMaldivesMaliMaltaMarshall IslandsMauritaniaMauritiusMexicoMicronesia, Fed. Sts.Middle East & North AfricaMiddle East & North Africa (excluding high income)Middle East & North Africa (IDA & IBRD countries)Middle incomeMoldovaMongoliaMoroccoMozambiqueMyanmarNamibiaNauruNepalNetherlandsNew CaledoniaNew ZealandNicaraguaNigerNigeriaNorth AmericaNorthern Mariana IslandsNorwayOECD membersOmanOther small statesPacific island small statesPakistanPalauPanamaPapua New GuineaParaguayPeruPhilippinesPolandPortugalPost-demographic dividendPre-demographic dividendPuerto RicoQatarRomaniaRussian FederationRwandaSamoaSao Tome and PrincipeSaudi ArabiaSenegalSerbiaSeychellesSierra LeoneSingaporeSlovak RepublicSloveniaSmall statesSolomon IslandsSomaliaSouth AfricaSouth AsiaSouth Asia (IDA & IBRD)SpainSri LankaSt. Kitts and NevisSt. LuciaSt. Vincent and the GrenadinesSub-Saharan Africa Sub-Saharan Africa (excluding high income)Sub-Saharan Africa (IDA & IBRD countries)SudanSurinameSwazilandSwedenSwitzerlandSyrian Arab RepublicTajikistanTanzaniaThailandTimor-LesteTogoTongaTrinidad and TobagoTunisiaTurkeyTurkmenistanTurks and Caicos IslandsTuvaluUgandaUkraineUnited Arab EmiratesUnited KingdomUnited StatesUpper middle incomeUruguayUzbekistanVanuatuVenezuela, RBVietnamVirgin Islands (U.S.)WorldYemen, Rep.ZambiaZimbabwe La ligne de temps
Cette échelle de temps montre un graphique de 1971 année à 2009 année Guyana. Les données jusqu'à 1970 année ne sont pas présentés. Quantité d'observations actuelles selon dates: 39.
Source (désignation):
Les indicateurs du développement mondiale
Source (organisation):
World Bank staff estimates from original source: European Commission, Joint Research Centre (JRC)/Netherlands Environmental Assessment Agency (PBL). Emission Database for Global Atmospheric Research (EDGAR): http://edgar.jrc.ec.europa.eu/.
Catégories:
Energy & Mining, Environment
Dernière mise à jour
23 avr. 2017
Les indicateurs de changement de valeurs selon les années
Minimum:
1.651
1 janv. 1999
Maximum:
6.937
1 janv. 1993
Pour la date d''observation
Valeur
Changement absolu
Le changement par rapport à la valeur précédente
1 janv. 1971
3.494
+3.494
0.0%
1 janv. 1972
4.246
+0.752
21.52%
1 janv. 1973
4.563
+0.316
7.45%
1 janv. 1974
4.698
+0.135
2.96%
1 janv. 1975
3.898
-0.8
-17.02%
1 janv. 1976
3.448
-0.45
-11.54%
1 janv. 1977
3.799
+0.351
10.17%
1 janv. 1978
3.854
+0.055
1.45%
1 janv. 1979
3.857
+0.003
0.09%
1 janv. 1980
4.542
+0.684
17.74%
1 janv. 1981
4.366
-0.176
-3.87%
1 janv. 1982
5.063
+0.697
15.97%
1 janv. 1983
4.767
-0.296
-5.85%
1 janv. 1984
5.443
+0.676
14.18%
1 janv. 1985
5.816
+0.373
6.85%
1 janv. 1986
5.895
+0.08
1.37%
1 janv. 1987
5.377
-0.519
-8.8%
1 janv. 1988
4.993
-0.384
-7.15%
1 janv. 1989
5.491
+0.498
9.98%
1 janv. 1990
5.566
+0.075
1.37%
1 janv. 1991
5.693
+0.127
2.28%
1 janv. 1992
5.141
-0.552
-9.7%
1 janv. 1993
6.937
+1.795
34.92%
1 janv. 1994
6.213
-0.724
-10.43%
1 janv. 1995
5.08
-1.133
-18.24%
1 janv. 1996
4.338
-0.742
-14.61%
1 janv. 1997
4.272
-0.066
-1.53%
1 janv. 1998
4.229
-0.043
-1.0%
1 janv. 1999
1.651
-2.577
-60.95%
1 janv. 2000
5.907
+4.255
257.67%
1 janv. 2001
6.736
+0.829
14.03%
1 janv. 2002
5.566
-1.169
-17.36%
1 janv. 2003
5.865
+0.299
5.37%
1 janv. 2004
5.536
-0.329
-5.6%
1 janv. 2005
5.425
-0.112
-2.02%
1 janv. 2006
5.479
+0.055
1.01%
1 janv. 2007
6.158
+0.679
12.39%
1 janv. 2008
5.727
-0.431
-7.01%
1 janv. 2009
5.439
-0.287
-5.02%
Classement des pays selon les statistiques actuelles par années


Commentaires: