29
/fr/
fr
AIzaSyAYiBZKx7MnpbEhh9jyipgxe19OcubqV5w
April 1, 2024
129129
Estonia
EST
true
2
1
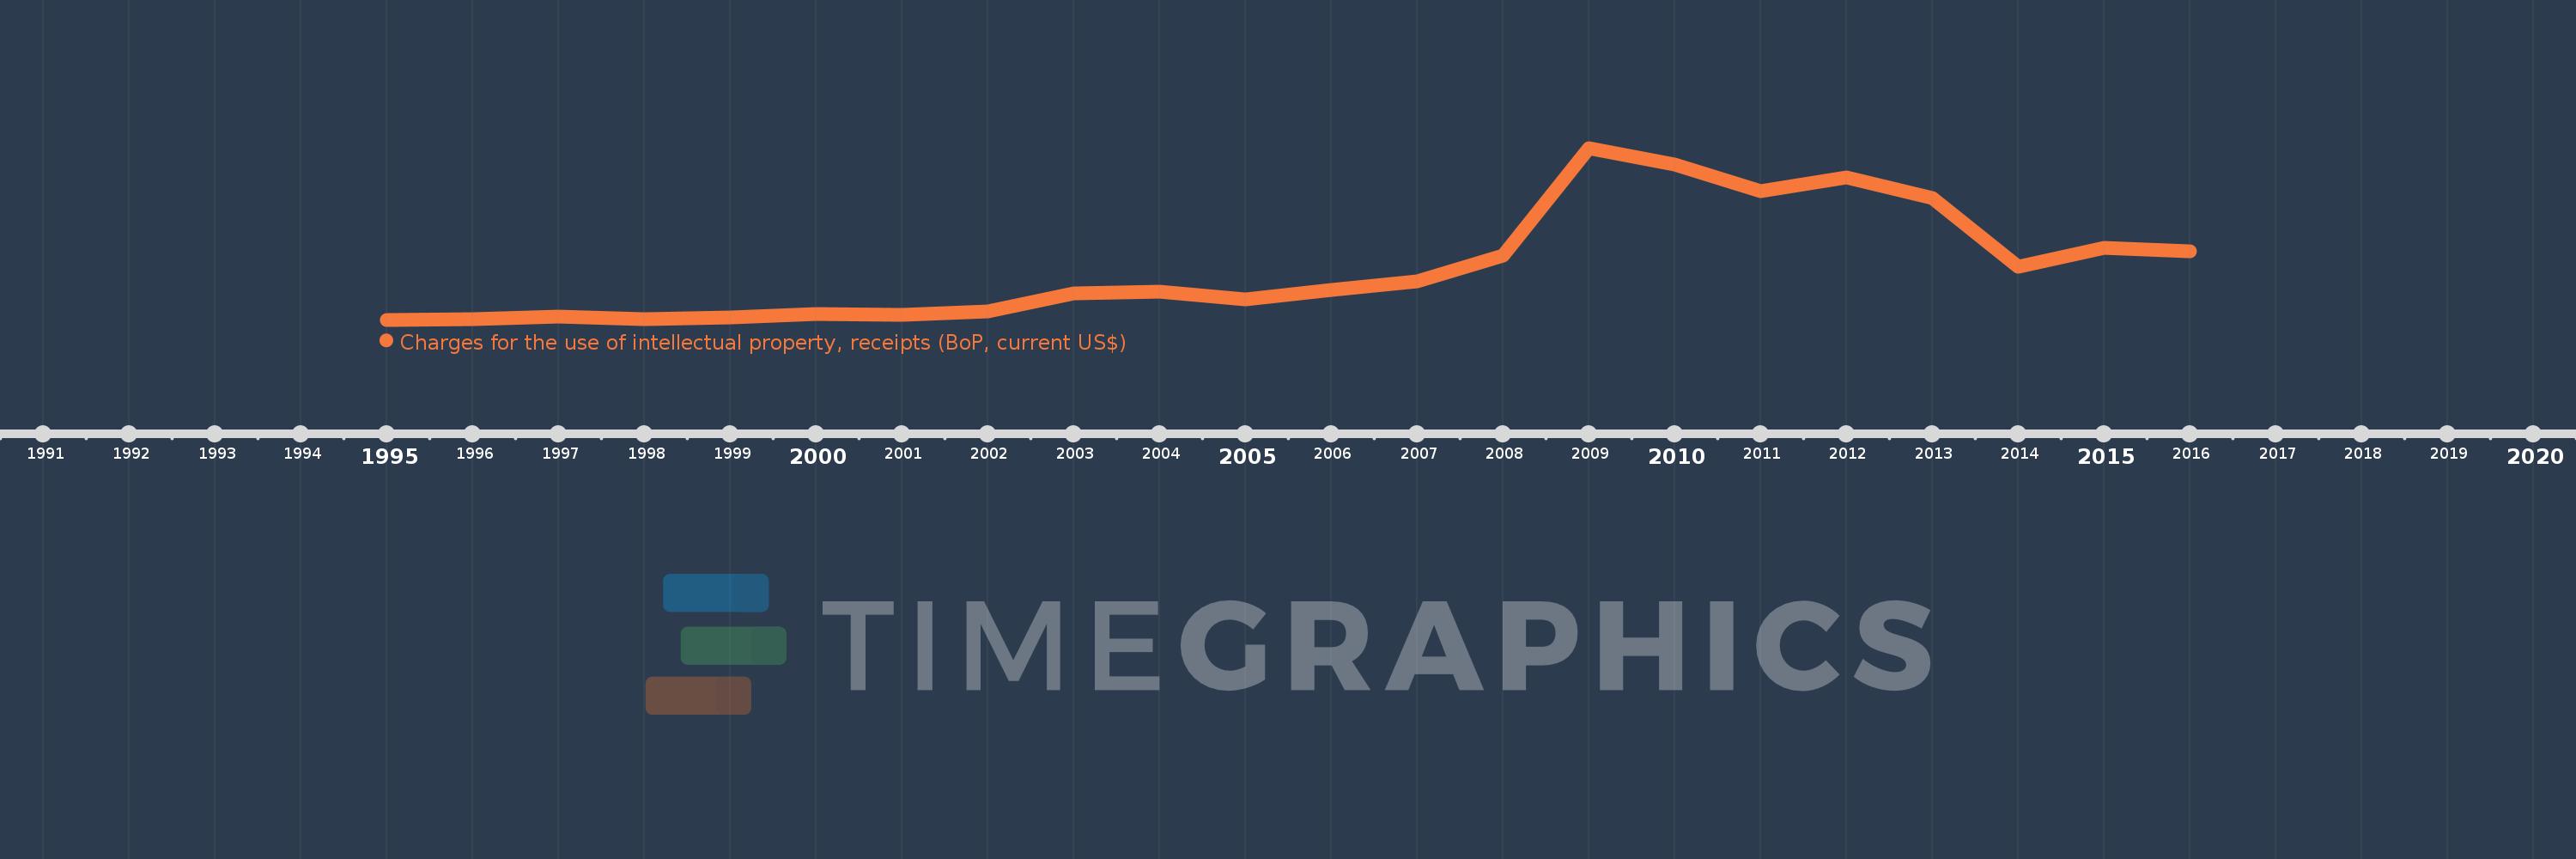
Charges for the use of intellectual property, receipts (BoP, current US$)
2016,2015,2014,2013,2012,2011,2010,2009,2008,2007,2006,2005,2004,2003,2002,2001,2000,1999,1998,1997,1996,1995
Cette statistique dans les autres pays:
La ligne de temps
Cette échelle de temps montre un graphique de 1995 année à 2016 année Estonia. Les données jusqu'à 1994 année ne sont pas présentés. Quantité d'observations actuelles selon dates: 22.
Source (désignation):
Les indicateurs du développement mondiale
Source (organisation):
International Monetary Fund, Balance of Payments Statistics Yearbook and data files.
Catégories:
Economy & Growth, Science & Technology
Dernière mise à jour
23 avr. 2017
Les indicateurs de changement de valeurs selon les années
Minimum:
860.853 milles
1 janv. 1995
Maximum:
26.919 mln.
1 janv. 2009
Pour la date d''observation
Valeur
Changement absolu
Le changement par rapport à la valeur précédente
1 janv. 1995
860.853 milles
+860.853 milles
0.0%
1 janv. 1996
942.782 milles
+81.929 milles
9.52%
1 janv. 1997
1.349 mln.
+406.275 milles
43.09%
1 janv. 1998
967.264 milles
-381.793 milles
-28.3%
1 janv. 1999
1.158 mln.
+190.676 milles
19.71%
1 janv. 2000
1.736 mln.
+577.849 milles
49.9%
1 janv. 2001
1.558 mln.
-177.96 milles
-10.25%
1 janv. 2002
2.125 mln.
+567.067 milles
36.4%
1 janv. 2003
4.915 mln.
+2.79 mln.
131.32%
1 janv. 2004
5.175 mln.
+259.166 milles
5.27%
1 janv. 2005
3.968 mln.
-1.206 mln.
-23.31%
1 janv. 2006
5.441 mln.
+1.472 mln.
37.11%
1 janv. 2007
6.645 mln.
+1.204 mln.
22.13%
1 janv. 2008
10.655 mln.
+4.01 mln.
60.35%
1 janv. 2009
26.919 mln.
+16.264 mln.
152.63%
1 janv. 2010
24.447 mln.
-2.472 mln.
-9.18%
1 janv. 2011
20.327 mln.
-4.12 mln.
-16.85%
1 janv. 2012
22.424 mln.
+2.097 mln.
10.32%
1 janv. 2013
19.315 mln.
-3.11 mln.
-13.87%
1 janv. 2014
8.94 mln.
-10.375 mln.
-53.72%
1 janv. 2015
11.758 mln.
+2.818 mln.
31.53%
1 janv. 2016
11.18 mln.
-577.819 milles
-4.91%
Classement des pays selon les statistiques actuelles par années


Commentaires: