29
/fr/
fr
AIzaSyAYiBZKx7MnpbEhh9jyipgxe19OcubqV5w
April 1, 2024
117681
Czech Republic
CZE
true
2
1
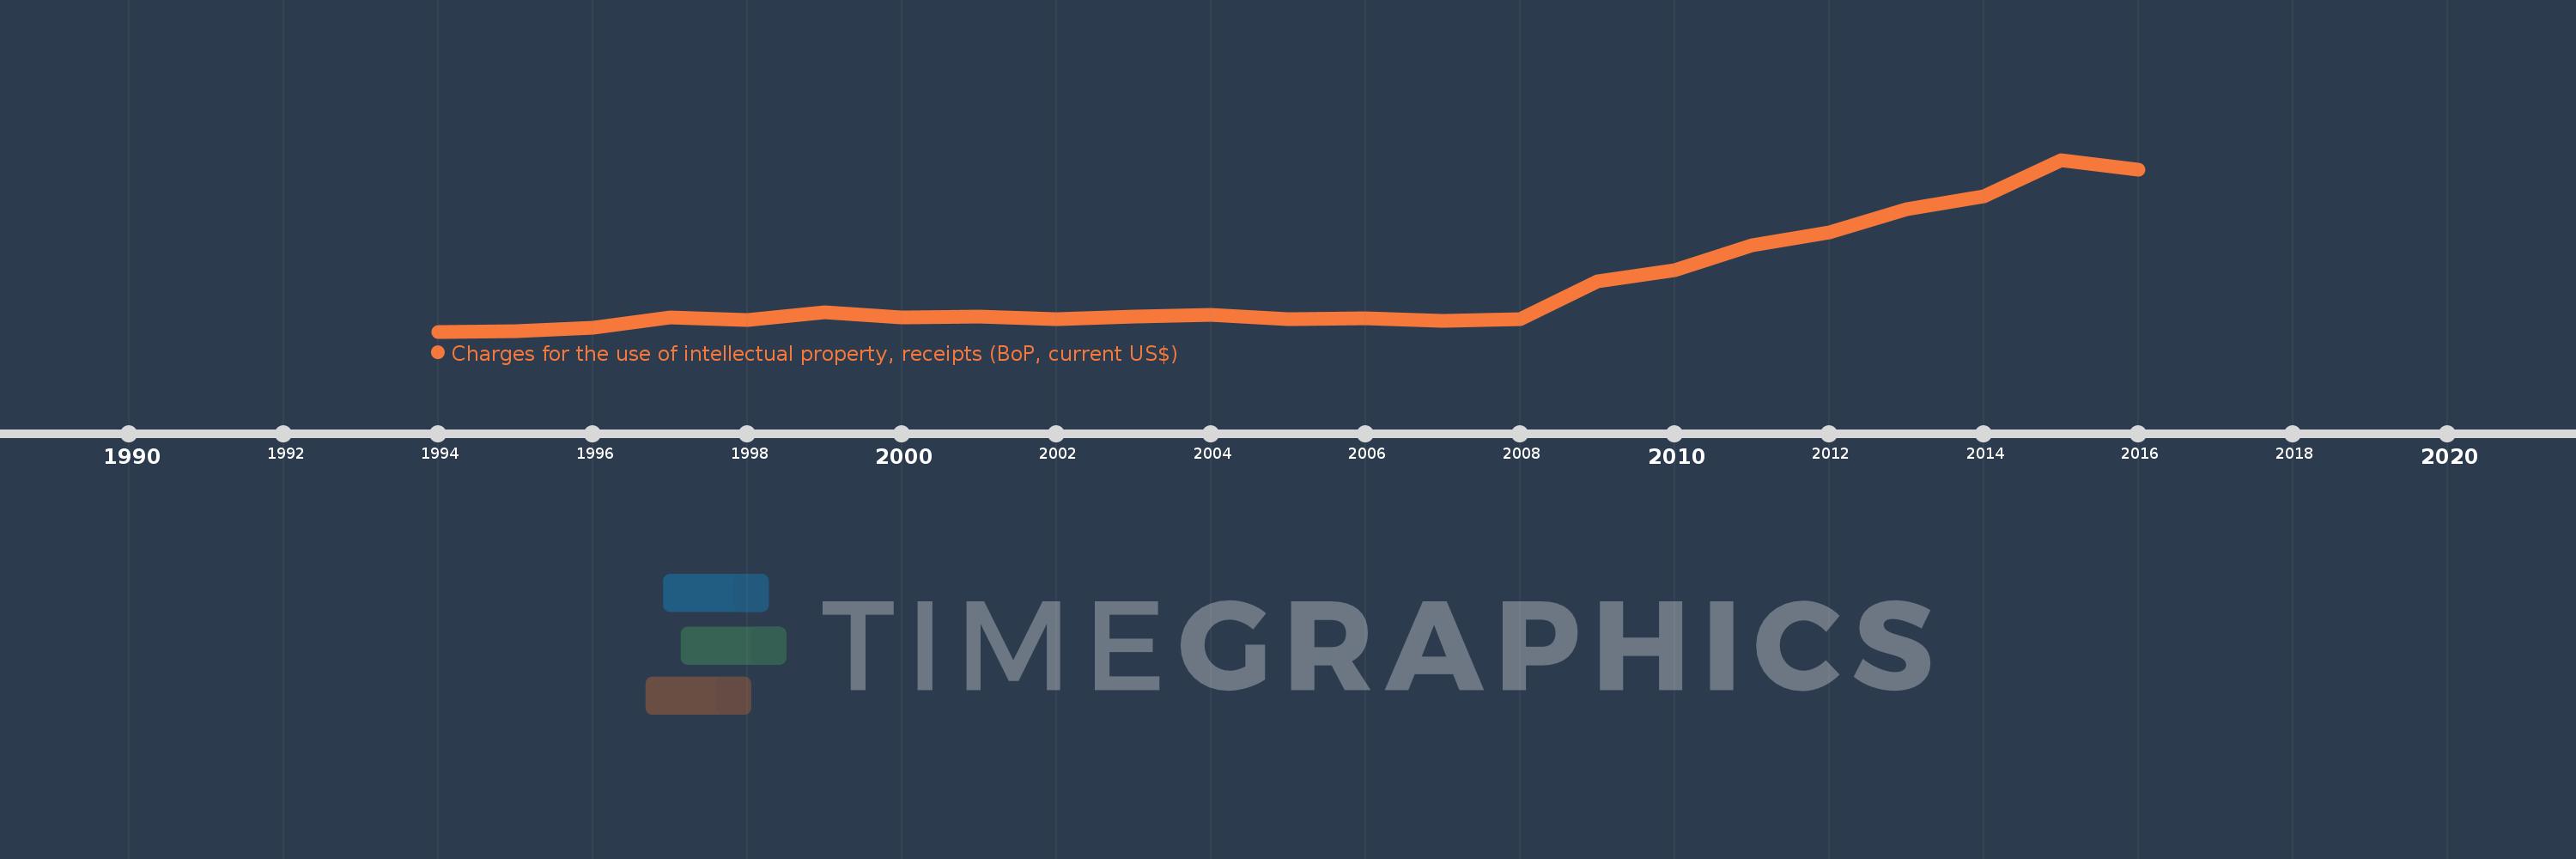
Charges for the use of intellectual property, receipts (BoP, current US$)
2016,2015,2014,2013,2012,2011,2010,2009,2008,2007,2006,2005,2004,2003,2002,2001,2000,1999,1998,1997,1996,1995,1994
Cette statistique dans les autres pays:
La ligne de temps
Cette échelle de temps montre un graphique de 1994 année à 2016 année Czech Republic. Les données jusqu'à 1993 année ne sont pas présentés. Quantité d'observations actuelles selon dates: 23.
Source (désignation):
Les indicateurs du développement mondiale
Source (organisation):
International Monetary Fund, Balance of Payments Statistics Yearbook and data files.
Catégories:
Economy & Growth, Science & Technology
Dernière mise à jour
23 avr. 2017
Les indicateurs de changement de valeurs selon les années
Minimum:
1.469 mln.
1 janv. 1994
Maximum:
493.181 mln.
1 janv. 2015
Pour la date d''observation
Valeur
Changement absolu
Le changement par rapport à la valeur précédente
1 janv. 1994
1.469 mln.
+1.469 mln.
0.0%
1 janv. 1995
3.681 mln.
+2.212 mln.
150.56%
1 janv. 1996
13.182 mln.
+9.501 mln.
258.15%
1 janv. 1997
42.784 mln.
+29.602 mln.
224.57%
1 janv. 1998
33.78 mln.
-9.004 mln.
-21.04%
1 janv. 1999
57.357 mln.
+23.577 mln.
69.79%
1 janv. 2000
42.909 mln.
-14.448 mln.
-25.19%
1 janv. 2001
44.285 mln.
+1.376 mln.
3.21%
1 janv. 2002
36.486 mln.
-7.8 mln.
-17.61%
1 janv. 2003
45.281 mln.
+8.795 mln.
24.11%
1 janv. 2004
50.304 mln.
+5.023 mln.
11.09%
1 janv. 2005
37.613 mln.
-12.691 mln.
-25.23%
1 janv. 2006
39.807 mln.
+2.194 mln.
5.83%
1 janv. 2007
31.712 mln.
-8.095 mln.
-20.34%
1 janv. 2008
35.923 mln.
+4.211 mln.
13.28%
1 janv. 2009
144.905 mln.
+108.982 mln.
303.38%
1 janv. 2010
177.971 mln.
+33.066 mln.
22.82%
1 janv. 2011
249.267 mln.
+71.297 mln.
40.06%
1 janv. 2012
284.733 mln.
+35.466 mln.
14.23%
1 janv. 2013
352.175 mln.
+67.442 mln.
23.69%
1 janv. 2014
388.825 mln.
+36.65 mln.
10.41%
1 janv. 2015
493.181 mln.
+104.356 mln.
26.84%
1 janv. 2016
465.932 mln.
-27.249 mln.
-5.53%
Classement des pays selon les statistiques actuelles par années


Commentaires: