29
/es/
es
AIzaSyAYiBZKx7MnpbEhh9jyipgxe19OcubqV5w
April 1, 2024
98440
Cambodia
KHM
true
2
1
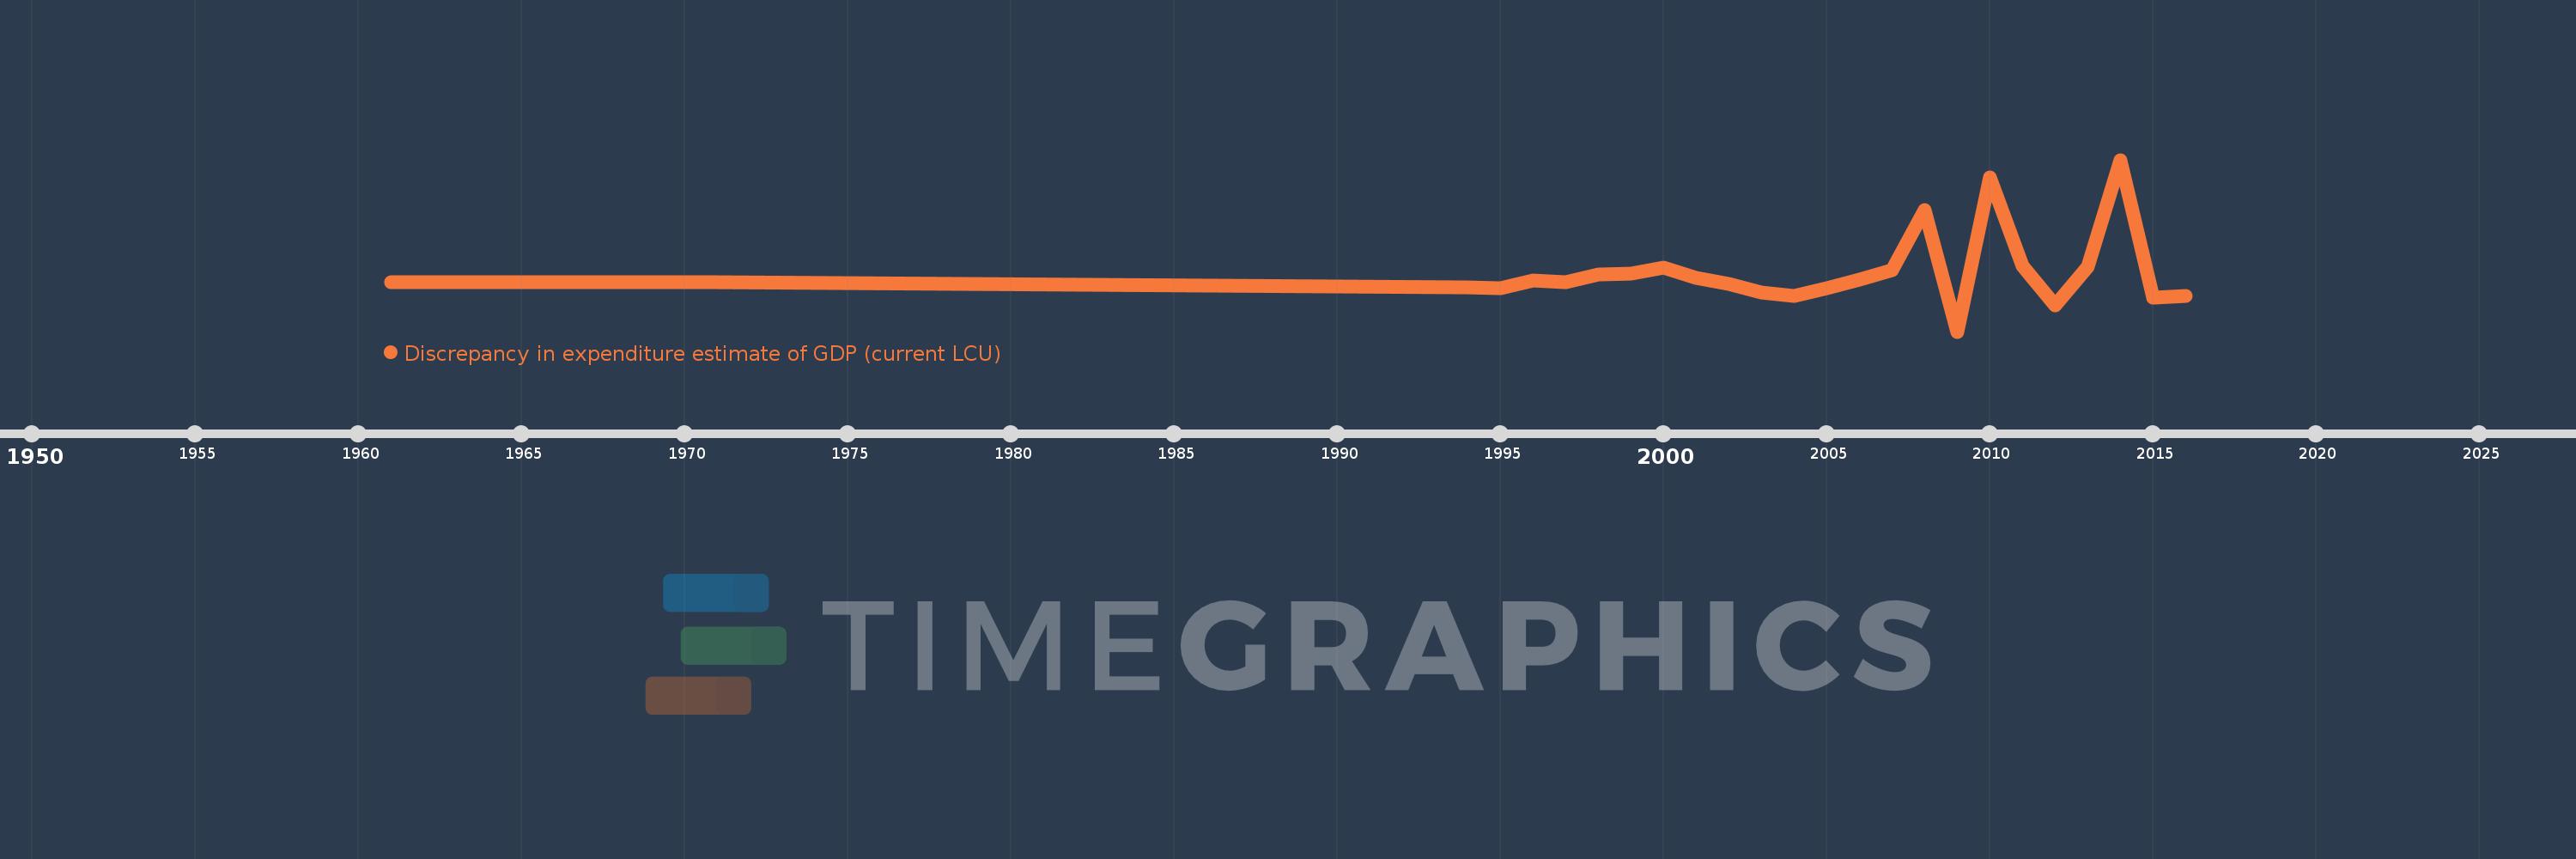
Discrepancy in expenditure estimate of GDP (current LCU)
2016,2015,2014,2013,2012,2011,2010,2009,2008,2007,2006,2005,2004,2003,2002,2001,2000,1999,1998,1997,1996,1995,1994,1971,1970,1969,1968,1967,1966,1965,1964,1963,1962,1961
Estas estadísticas en otros países:
AfghanistanAlbaniaAlgeriaAngolaAntigua and BarbudaArgentinaArmeniaArubaAustraliaAustriaAzerbaijanBahamas, TheBahrainBangladeshBarbadosBelarusBelgiumBelizeBeninBermudaBhutanBoliviaBosnia and HerzegovinaBotswanaBrazilBrunei DarussalamBulgariaBurkina FasoBurundiCabo VerdeCambodiaCameroonCanadaCentral African RepublicChadChileChinaColombiaComorosCongo, Dem. Rep.Congo, Rep.Costa RicaCote d'IvoireCroatiaCubaCyprusCzech RepublicDenmarkDjiboutiDominicaDominican RepublicEcuadorEgypt, Arab Rep.El SalvadorEquatorial GuineaEritreaEstoniaEthiopiaFaroe IslandsFijiFinlandFranceGabonGambia, TheGeorgiaGermanyGhanaGreeceGrenadaGuatemalaGuineaGuinea-BissauGuyanaHaitiHondurasHong Kong SAR, ChinaHungaryIcelandIndiaIndonesiaIran, Islamic Rep.IrelandIsraelItalyJamaicaJapanJordanKazakhstanKenyaKiribatiKorea, Rep.KosovoKuwaitKyrgyz RepublicLao PDRLatviaLebanonLesothoLiberiaLibyaLithuaniaLuxembourgMacao SAR, ChinaMacedonia, FYRMadagascarMalawiMalaysiaMaliMaltaMauritaniaMauritiusMexicoMicronesia, Fed. Sts.MoldovaMongoliaMontenegroMoroccoMozambiqueNamibiaNepalNetherlandsNew CaledoniaNew ZealandNicaraguaNigerNigeriaNorwayOmanPakistanPanamaPapua New GuineaParaguayPeruPhilippinesPolandPortugalPuerto RicoQatarRomaniaRussian FederationRwandaSaudi ArabiaSenegalSerbiaSeychellesSierra LeoneSingaporeSlovak RepublicSloveniaSolomon IslandsSomaliaSouth AfricaSouth SudanSpainSri LankaSt. Kitts and NevisSt. LuciaSt. Vincent and the GrenadinesSudanSurinameSwazilandSwedenSwitzerlandSyrian Arab RepublicTajikistanTanzaniaThailandTimor-LesteTogoTongaTrinidad and TobagoTunisiaTurkeyTurkmenistanUgandaUkraineUnited Arab EmiratesUnited KingdomUnited StatesUruguayUzbekistanVanuatuVenezuela, RBVietnamWest Bank and GazaYemen, Rep.ZambiaZimbabwe línea de tiempo (timeline):
En esta escala de tiempo se presenta un gráfico de 1961 y 2016 de Cambodia. Los datos de 1960 están ausentes. El número de observaciones reales por fecha: 34.
Fuente (nombre):
Indicadores del desarrollo mundial
Fuente (organización):
World Bank national accounts data, and OECD National Accounts data files.
Categorías:
Economy & Growth
Se ha actualizado:
23 abr 2017 año
Los indicadores de los cambios de valor en los últimos años
Mínimo:
-613.395 bn
1 ene 2009 año
Máximo:
1.513 billones
1 ene 2014 año
A la fecha de observación
Valor
Cambio absoluto
El cambio con respecto al valor anterior
1 ene 1961 año
1.1 mil
+1.1 mil
0.0%
1 ene 1962 año
-300.0
-1.4 mil
-127.27%
1 ene 1963 año
0.0
+300.0
-100.0%
1 ene 1964 año
1.1 mil
+1.1 mil
%
1 ene 1965 año
800.0
-300.0
-27.27%
1 ene 1966 año
600.0
-200.0
-25.0%
1 ene 1967 año
600.0
+0.0
0.0%
1 ene 1968 año
-600.0
-1.2 mil
-200.0%
1 ene 1969 año
100.0
+700.0
-116.67%
1 ene 1970 año
200.0
+100.0
100.0%
1 ene 1971 año
1.6 mil
+1.4 mil
700.0%
1 ene 1994 año
-61.382 bn
-61.382 bn
-3.84 bn%
1 ene 1995 año
-71.866 bn
-10.484 bn
17.08%
1 ene 1996 año
15.112 bn
+86.978 bn
-121.03%
1 ene 1997 año
-4.202 bn
-19.314 bn
-127.81%
1 ene 1998 año
92.043 bn
+96.245 bn
-2.29 mil%
1 ene 1999 año
103.373 bn
+11.33 bn
12.31%
1 ene 2000 año
177.675 bn
+74.302 bn
71.88%
1 ene 2001 año
48.906 bn
-128.769 bn
-72.47%
1 ene 2002 año
-24.921 bn
-73.828 bn
-150.96%
1 ene 2003 año
-130.671 bn
-105.75 bn
424.33%
1 ene 2004 año
-169.873 bn
-39.202 bn
30.0%
1 ene 2005 año
-78.254 bn
+91.619 bn
-53.93%
1 ene 2006 año
26.185 bn
+104.438 bn
-133.46%
1 ene 2007 año
145.83 bn
+119.645 bn
456.93%
1 ene 2008 año
890.036 bn
+744.206 bn
510.32%
1 ene 2009 año
-613.395 bn
-1.503 billones
-168.92%
1 ene 2010 año
1.298 billones
+1.911 billones
-311.6%
1 ene 2011 año
204.172 bn
-1.094 billones
-84.27%
1 ene 2012 año
-289.875 bn
-494.047 bn
-241.98%
1 ene 2013 año
184.748 bn
+474.623 bn
-163.73%
1 ene 2014 año
1.513 billones
+1.328 billones
718.96%
1 ene 2015 año
-191.243 bn
-1.704 billones
-112.64%
1 ene 2016 año
-168.069 bn
+23.174 bn
-12.12%
Ranking de los países por los datos estadísticos actuales


Comentarios: