29
/es/
es
AIzaSyAYiBZKx7MnpbEhh9jyipgxe19OcubqV5w
April 1, 2024
135389
Gabon
GAB
true
2
1
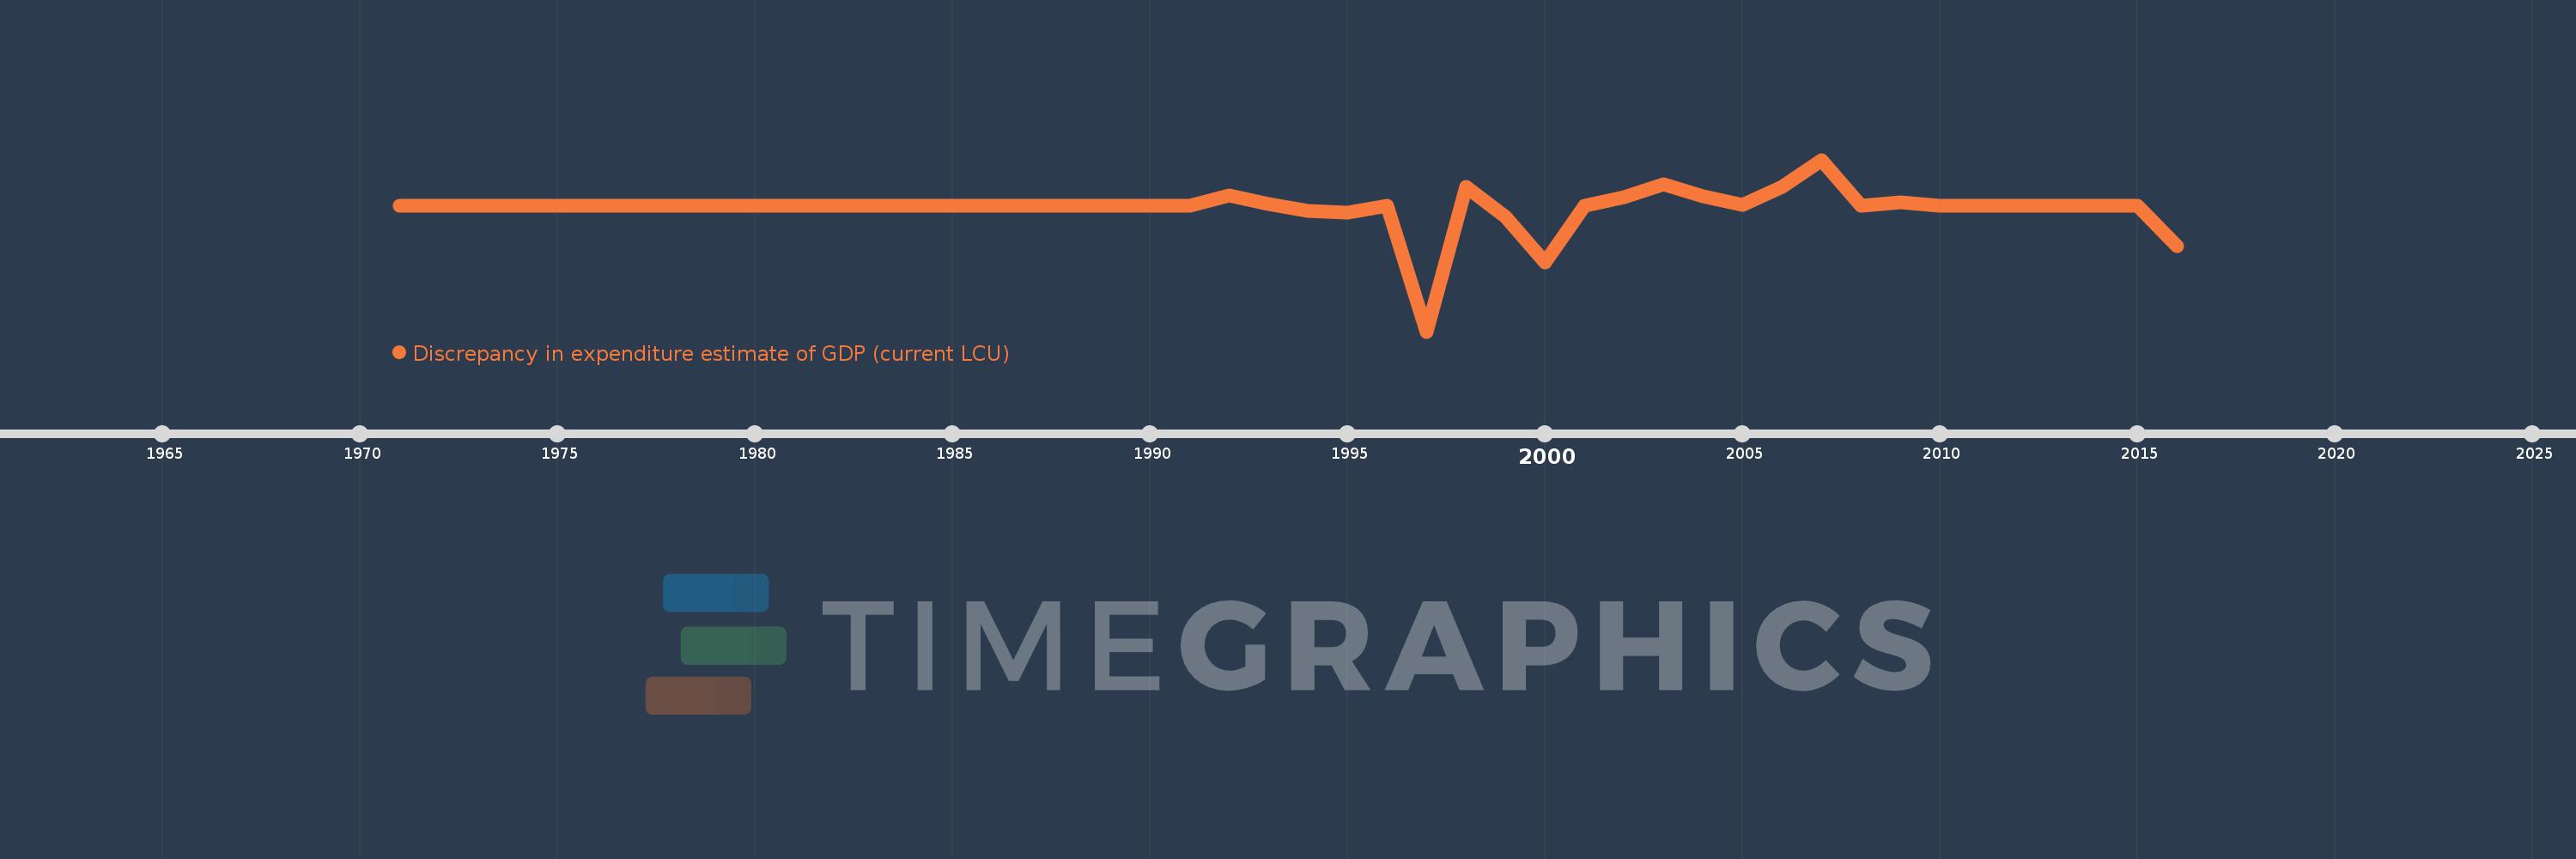
Discrepancy in expenditure estimate of GDP (current LCU)
2016,2015,2014,2013,2012,2011,2010,2009,2008,2007,2006,2005,2004,2003,2002,2001,2000,1999,1998,1997,1996,1995,1994,1993,1992,1991,1990,1989,1988,1987,1986,1985,1984,1983,1982,1981,1980,1979,1978,1977,1976,1975,1974,1973,1972,1971
Estas estadísticas en otros países:
AfghanistanAlbaniaAlgeriaAngolaAntigua and BarbudaArgentinaArmeniaArubaAustraliaAustriaAzerbaijanBahamas, TheBahrainBangladeshBarbadosBelarusBelgiumBelizeBeninBermudaBhutanBoliviaBosnia and HerzegovinaBotswanaBrazilBrunei DarussalamBulgariaBurkina FasoBurundiCabo VerdeCambodiaCameroonCanadaCentral African RepublicChadChileChinaColombiaComorosCongo, Dem. Rep.Congo, Rep.Costa RicaCote d'IvoireCroatiaCubaCyprusCzech RepublicDenmarkDjiboutiDominicaDominican RepublicEcuadorEgypt, Arab Rep.El SalvadorEquatorial GuineaEritreaEstoniaEthiopiaFaroe IslandsFijiFinlandFranceGabonGambia, TheGeorgiaGermanyGhanaGreeceGrenadaGuatemalaGuineaGuinea-BissauGuyanaHaitiHondurasHong Kong SAR, ChinaHungaryIcelandIndiaIndonesiaIran, Islamic Rep.IrelandIsraelItalyJamaicaJapanJordanKazakhstanKenyaKiribatiKorea, Rep.KosovoKuwaitKyrgyz RepublicLao PDRLatviaLebanonLesothoLiberiaLibyaLithuaniaLuxembourgMacao SAR, ChinaMacedonia, FYRMadagascarMalawiMalaysiaMaliMaltaMauritaniaMauritiusMexicoMicronesia, Fed. Sts.MoldovaMongoliaMontenegroMoroccoMozambiqueNamibiaNepalNetherlandsNew CaledoniaNew ZealandNicaraguaNigerNigeriaNorwayOmanPakistanPanamaPapua New GuineaParaguayPeruPhilippinesPolandPortugalPuerto RicoQatarRomaniaRussian FederationRwandaSaudi ArabiaSenegalSerbiaSeychellesSierra LeoneSingaporeSlovak RepublicSloveniaSolomon IslandsSomaliaSouth AfricaSouth SudanSpainSri LankaSt. Kitts and NevisSt. LuciaSt. Vincent and the GrenadinesSudanSurinameSwazilandSwedenSwitzerlandSyrian Arab RepublicTajikistanTanzaniaThailandTimor-LesteTogoTongaTrinidad and TobagoTunisiaTurkeyTurkmenistanUgandaUkraineUnited Arab EmiratesUnited KingdomUnited StatesUruguayUzbekistanVanuatuVenezuela, RBVietnamWest Bank and GazaYemen, Rep.ZambiaZimbabwe línea de tiempo (timeline):
En esta escala de tiempo se presenta un gráfico de 1971 y 2016 de Gabon. Los datos de 1970 están ausentes. El número de observaciones reales por fecha: 46.
Fuente (nombre):
Indicadores del desarrollo mundial
Fuente (organización):
World Bank national accounts data, and OECD National Accounts data files.
Categorías:
Economy & Growth
Se ha actualizado:
23 abr 2017 año
Los indicadores de los cambios de valor en los últimos años
Mínimo:
-142.6 bn
1 ene 1997 año
Máximo:
52.48 bn
1 ene 2007 año
A la fecha de observación
Valor
Cambio absoluto
El cambio con respecto al valor anterior
1 ene 1971 año
0.0
+0.0
0.0%
1 ene 1972 año
0.0
+0.0
26.67%
1 ene 1973 año
0.0
0.0
-21.05%
1 ene 1974 año
0.0
0.0
-100.0%
1 ene 1977 año
0.0
0.0
-300.0%
1 ene 1978 año
0.0
0.0
50.0%
1 ene 1979 año
0.0
+0.0
-83.33%
1 ene 1980 año
0.0
+0.0
-100.0%
1 ene 1983 año
0.0
+0.0
-100.0%
1 ene 1986 año
0.0
0.0
-100.0%
1 ene 1989 año
0.0
0.0
-300.0%
1 ene 1990 año
0.0
+0.0
-100.0%
1 ene 1992 año
11.98 bn
+11.98 bn
9983.33 billones%
1 ene 1993 año
2.613 bn
-9.367 bn
-78.19%
1 ene 1994 año
-5.745 bn
-8.358 bn
-319.86%
1 ene 1995 año
-7.113 bn
-1.368 bn
23.81%
1 ene 1996 año
290.02 millones
+7.403 bn
-104.08%
1 ene 1997 año
-142.6 bn
-142.89 bn
-49.27 mil%
1 ene 1998 año
22.1 bn
+164.7 bn
-115.5%
1 ene 1999 año
-12.4 bn
-34.5 bn
-156.11%
1 ene 2000 año
-64.0 bn
-51.6 bn
416.13%
1 ene 2001 año
0.0
+64.0 bn
-100.0%
1 ene 2002 año
10.21 bn
+10.21 bn
%
1 ene 2003 año
24.242 bn
+14.032 bn
137.44%
1 ene 2004 año
10.895 bn
-13.347 bn
-55.06%
1 ene 2005 año
1.585 bn
-9.31 bn
-85.45%
1 ene 2006 año
21.871 bn
+20.286 bn
1.28 mil%
1 ene 2007 año
52.48 bn
+30.609 bn
139.95%
1 ene 2008 año
-0.001
-52.48 bn
-100.0%
1 ene 2009 año
4.384 bn
+4.384 bn
-876.72 billones%
1 ene 2010 año
0.001
-4.384 bn
-100.0%
1 ene 2011 año
-0.001
-0.001
-156.52%
1 ene 2012 año
0.001
+0.001
-196.15%
1 ene 2013 año
0.001
+0.001
100.0%
1 ene 2014 año
-100.001
-100.002
-10.0 millones%
1 ene 2015 año
-0.002
+99.999
-100.0%
1 ene 2016 año
-45.951 bn
-45.951 bn
2702.98 billones%
Ranking de los países por los datos estadísticos actuales


Comentarios: