29
/es/
es
AIzaSyAYiBZKx7MnpbEhh9jyipgxe19OcubqV5w
April 1, 2024
97222
Cabo Verde
CPV
true
2
1
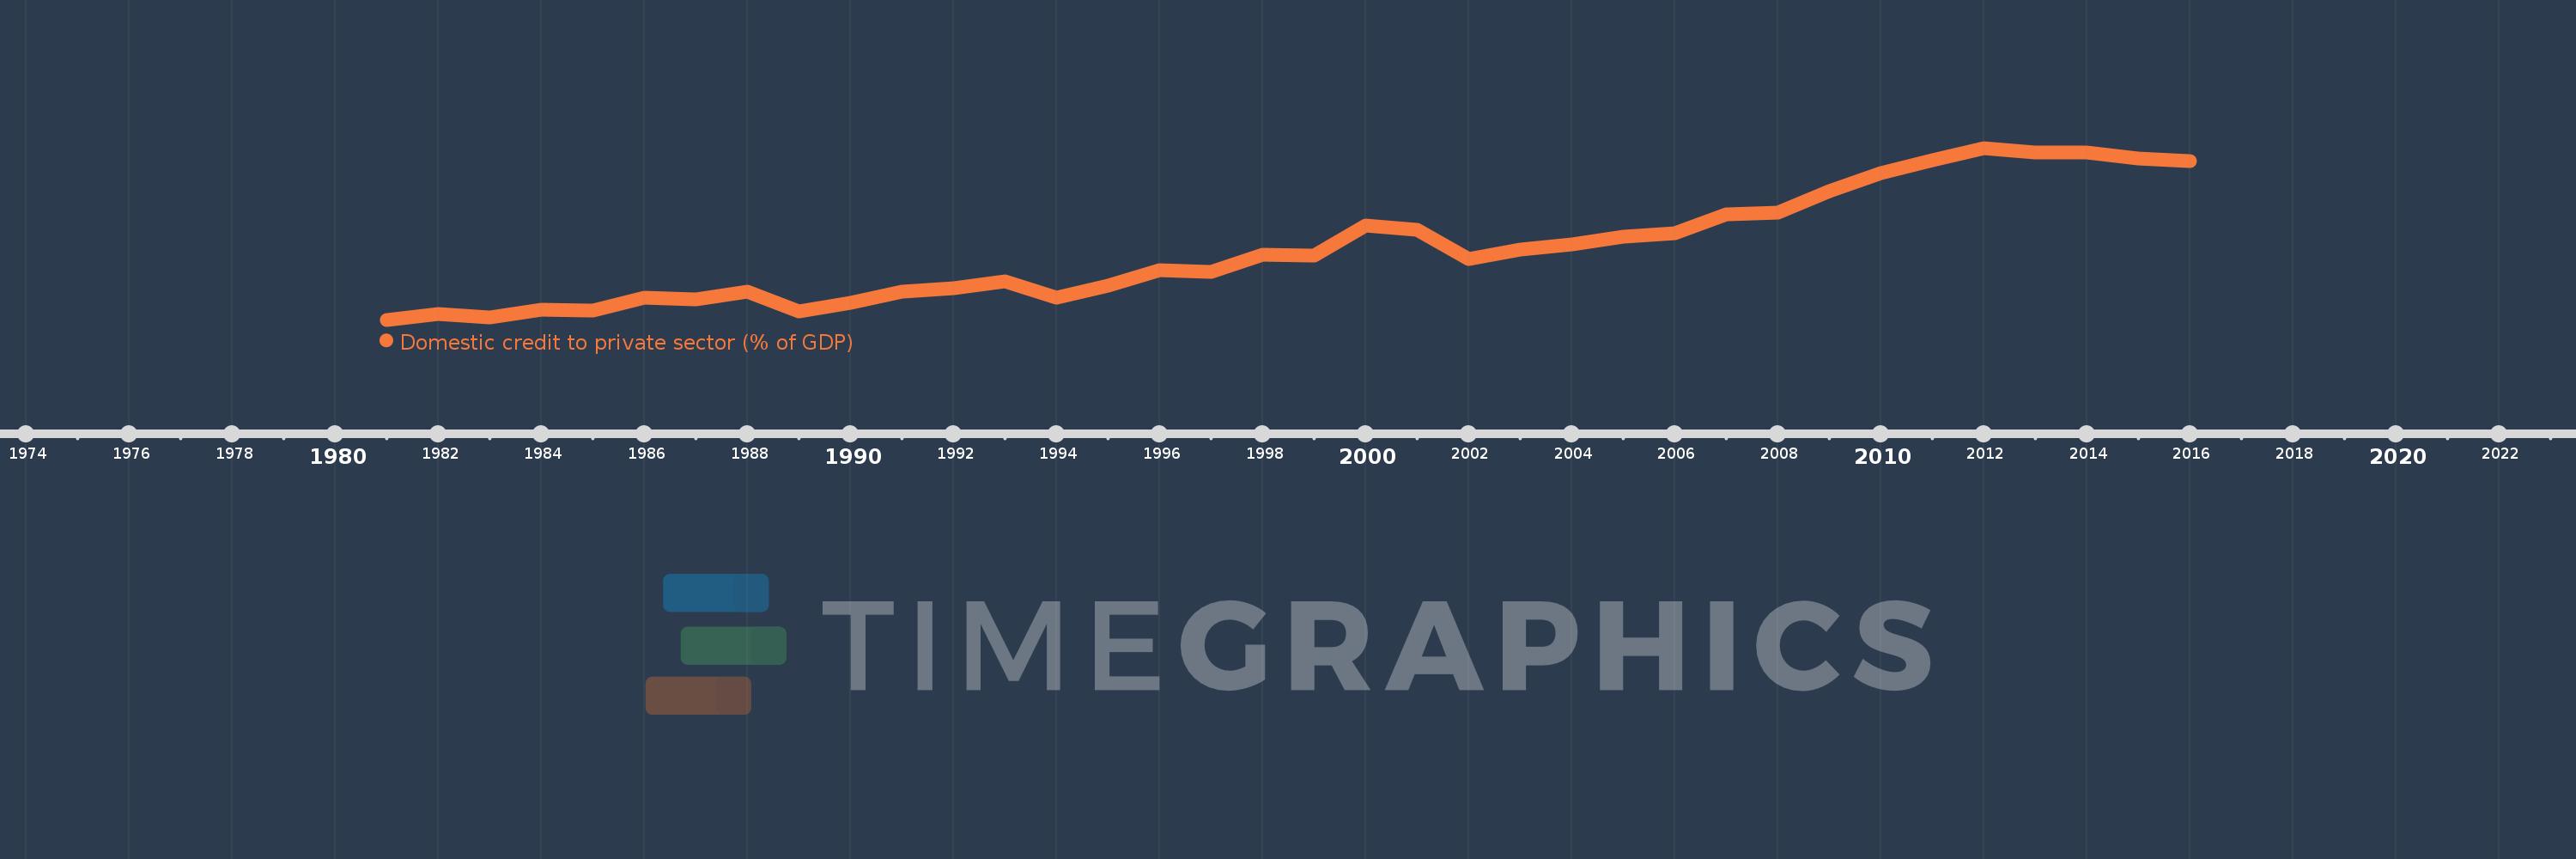
Domestic credit to private sector (% of GDP)
2016,2015,2014,2013,2012,2011,2010,2009,2008,2007,2006,2005,2004,2003,2002,2001,2000,1999,1998,1997,1996,1995,1994,1993,1992,1991,1990,1989,1988,1987,1986,1985,1984,1983,1982,1981
Estas estadísticas en otros países:
AfghanistanAlbaniaAlgeriaAngolaAntigua and BarbudaArab WorldArgentinaArmeniaArubaAustraliaAustriaAzerbaijanBahamas, TheBahrainBangladeshBarbadosBelarusBelgiumBelizeBeninBhutanBoliviaBosnia and HerzegovinaBotswanaBrazilBrunei DarussalamBulgariaBurkina FasoBurundiCabo VerdeCambodiaCameroonCanadaCaribbean small statesCentral African RepublicCentral Europe and the BalticsChadChileChinaColombiaComorosCongo, Dem. Rep.Congo, Rep.Costa RicaCote d'IvoireCroatiaCyprusCzech RepublicDenmarkDjiboutiDominicaDominican RepublicEarly-demographic dividendEast Asia & PacificEast Asia & Pacific (excluding high income)East Asia & Pacific (IDA & IBRD countries)EcuadorEgypt, Arab Rep.El SalvadorEquatorial GuineaEritreaEstoniaEthiopiaEuro areaEurope & Central AsiaEurope & Central Asia (excluding high income)Europe & Central Asia (IDA & IBRD countries)European UnionFijiFinlandFragile and conflict affected situationsFranceGabonGambia, TheGeorgiaGermanyGhanaGreeceGrenadaGuatemalaGuineaGuinea-BissauGuyanaHaitiHeavily indebted poor countries (HIPC)High incomeHondurasHong Kong SAR, ChinaHungaryIBRD onlyIcelandIDA & IBRD totalIDA blendIDA onlyIDA totalIndiaIndonesiaIran, Islamic Rep.IraqIrelandIsraelItalyJamaicaJapanJordanKazakhstanKenyaKorea, Rep.KosovoKuwaitKyrgyz RepublicLao PDRLate-demographic dividendLatin America & Caribbean Latin America & Caribbean (excluding high income)Latin America & the Caribbean (IDA & IBRD countries)LatviaLeast developed countries: UN classificationLebanonLesothoLiberiaLibyaLithuaniaLow & middle incomeLow incomeLower middle incomeLuxembourgMacao SAR, ChinaMacedonia, FYRMadagascarMalawiMalaysiaMaldivesMaliMaltaMauritaniaMauritiusMexicoMicronesia, Fed. Sts.Middle East & North AfricaMiddle East & North Africa (excluding high income)Middle East & North Africa (IDA & IBRD countries)Middle incomeMoldovaMongoliaMontenegroMoroccoMozambiqueMyanmarNamibiaNepalNetherlandsNew ZealandNicaraguaNigerNigeriaNorth AmericaNorwayOECD membersOmanOther small statesPacific island small statesPakistanPanamaPapua New GuineaParaguayPeruPhilippinesPolandPortugalPost-demographic dividendPre-demographic dividendQatarRomaniaRussian FederationRwandaSamoaSao Tome and PrincipeSaudi ArabiaSenegalSerbiaSeychellesSierra LeoneSingaporeSlovak RepublicSloveniaSmall statesSolomon IslandsSouth AfricaSouth AsiaSouth Asia (IDA & IBRD)South SudanSpainSri LankaSt. Kitts and NevisSt. LuciaSt. Vincent and the GrenadinesSub-Saharan Africa Sub-Saharan Africa (excluding high income)Sub-Saharan Africa (IDA & IBRD countries)SudanSurinameSwazilandSwedenSwitzerlandSyrian Arab RepublicTajikistanTanzaniaThailandTimor-LesteTogoTongaTrinidad and TobagoTunisiaTurkeyUgandaUkraineUnited Arab EmiratesUnited KingdomUnited StatesUpper middle incomeUruguayVanuatuVenezuela, RBVietnamWest Bank and GazaWorldYemen, Rep.ZambiaZimbabwe línea de tiempo (timeline):
En esta escala de tiempo se presenta un gráfico de 1981 y 2016 de Cabo Verde. Los datos de 1980 están ausentes. El número de observaciones reales por fecha: 36.
Fuente (nombre):
Indicadores del desarrollo mundial
Fuente (organización):
International Monetary Fund, International Financial Statistics and data files, and World Bank and OECD GDP estimates.
Categorías:
Financial Sector, Private Sector
Se ha actualizado:
23 abr 2017 año
Los indicadores de los cambios de valor en los últimos años
Mínimo:
11.978
1 ene 1981 año
Máximo:
65.742
1 ene 2012 año
A la fecha de observación
Valor
Cambio absoluto
El cambio con respecto al valor anterior
1 ene 1981 año
11.978
+11.978
0.0%
1 ene 1982 año
13.806
+1.828
15.26%
1 ene 1983 año
12.598
-1.207
-8.75%
1 ene 1984 año
14.994
+2.395
19.01%
1 ene 1985 año
14.902
-0.092
-0.61%
1 ene 1986 año
18.893
+3.992
26.79%
1 ene 1987 año
18.451
-0.442
-2.34%
1 ene 1988 año
20.868
+2.417
13.1%
1 ene 1989 año
14.552
-6.316
-30.27%
1 ene 1990 año
17.237
+2.685
18.45%
1 ene 1991 año
20.742
+3.505
20.33%
1 ene 1992 año
21.736
+0.994
4.79%
1 ene 1993 año
24.114
+2.378
10.94%
1 ene 1994 año
19.019
-5.096
-21.13%
1 ene 1995 año
22.721
+3.703
19.47%
1 ene 1996 año
27.592
+4.871
21.44%
1 ene 1997 año
26.926
-0.666
-2.41%
1 ene 1998 año
32.222
+5.295
19.67%
1 ene 1999 año
32.167
-0.054
-0.17%
1 ene 2000 año
41.339
+9.172
28.51%
1 ene 2001 año
40.132
-1.208
-2.92%
1 ene 2002 año
31.054
-9.077
-22.62%
1 ene 2003 año
33.952
+2.898
9.33%
1 ene 2004 año
35.64
+1.688
4.97%
1 ene 2005 año
37.84
+2.199
6.17%
1 ene 2006 año
39.101
+1.261
3.33%
1 ene 2007 año
44.856
+5.755
14.72%
1 ene 2008 año
45.55
+0.694
1.55%
1 ene 2009 año
52.297
+6.747
14.81%
1 ene 2010 año
57.964
+5.667
10.84%
1 ene 2011 año
61.929
+3.965
6.84%
1 ene 2012 año
65.742
+3.812
6.16%
1 ene 2013 año
64.324
-1.417
-2.16%
1 ene 2014 año
64.185
-0.139
-0.22%
1 ene 2015 año
62.507
-1.679
-2.62%
1 ene 2016 año
61.545
-0.962
-1.54%
Ranking de los países por los datos estadísticos actuales


Comentarios: