29
/es/
es
AIzaSyAYiBZKx7MnpbEhh9jyipgxe19OcubqV5w
April 1, 2024
169768
Korea, Rep.
KOR
true
2
1
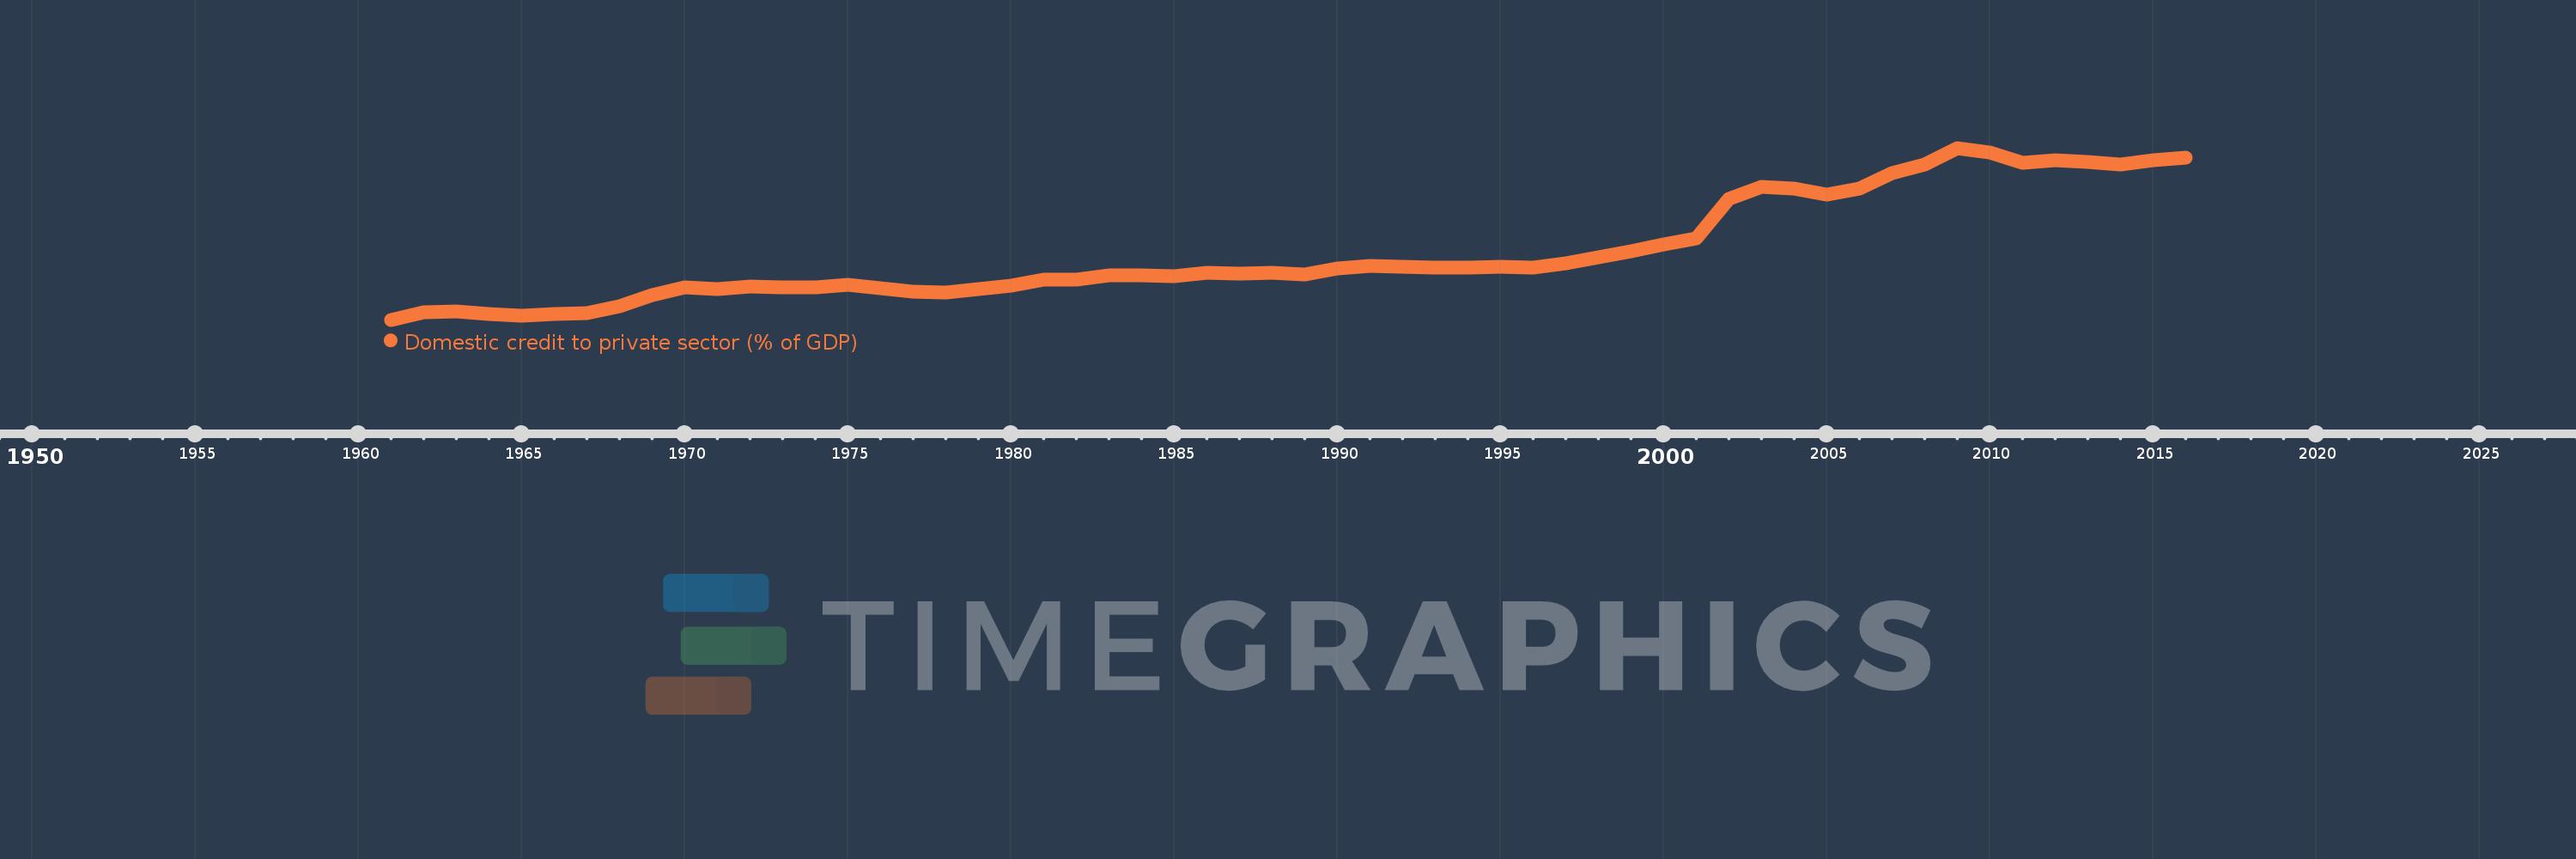
Domestic credit to private sector (% of GDP)
2016,2015,2014,2013,2012,2011,2010,2009,2008,2007,2006,2005,2004,2003,2002,2001,2000,1999,1998,1997,1996,1995,1994,1993,1992,1991,1990,1989,1988,1987,1986,1985,1984,1983,1982,1981,1980,1979,1978,1977,1976,1975,1974,1973,1972,1971,1970,1969,1968,1967,1966,1965,1964,1963,1962,1961
Estas estadísticas en otros países:
AfghanistanAlbaniaAlgeriaAngolaAntigua and BarbudaArab WorldArgentinaArmeniaArubaAustraliaAustriaAzerbaijanBahamas, TheBahrainBangladeshBarbadosBelarusBelgiumBelizeBeninBhutanBoliviaBosnia and HerzegovinaBotswanaBrazilBrunei DarussalamBulgariaBurkina FasoBurundiCabo VerdeCambodiaCameroonCanadaCaribbean small statesCentral African RepublicCentral Europe and the BalticsChadChileChinaColombiaComorosCongo, Dem. Rep.Congo, Rep.Costa RicaCote d'IvoireCroatiaCyprusCzech RepublicDenmarkDjiboutiDominicaDominican RepublicEarly-demographic dividendEast Asia & PacificEast Asia & Pacific (excluding high income)East Asia & Pacific (IDA & IBRD countries)EcuadorEgypt, Arab Rep.El SalvadorEquatorial GuineaEritreaEstoniaEthiopiaEuro areaEurope & Central AsiaEurope & Central Asia (excluding high income)Europe & Central Asia (IDA & IBRD countries)European UnionFijiFinlandFragile and conflict affected situationsFranceGabonGambia, TheGeorgiaGermanyGhanaGreeceGrenadaGuatemalaGuineaGuinea-BissauGuyanaHaitiHeavily indebted poor countries (HIPC)High incomeHondurasHong Kong SAR, ChinaHungaryIBRD onlyIcelandIDA & IBRD totalIDA blendIDA onlyIDA totalIndiaIndonesiaIran, Islamic Rep.IraqIrelandIsraelItalyJamaicaJapanJordanKazakhstanKenyaKorea, Rep.KosovoKuwaitKyrgyz RepublicLao PDRLate-demographic dividendLatin America & Caribbean Latin America & Caribbean (excluding high income)Latin America & the Caribbean (IDA & IBRD countries)LatviaLeast developed countries: UN classificationLebanonLesothoLiberiaLibyaLithuaniaLow & middle incomeLow incomeLower middle incomeLuxembourgMacao SAR, ChinaMacedonia, FYRMadagascarMalawiMalaysiaMaldivesMaliMaltaMauritaniaMauritiusMexicoMicronesia, Fed. Sts.Middle East & North AfricaMiddle East & North Africa (excluding high income)Middle East & North Africa (IDA & IBRD countries)Middle incomeMoldovaMongoliaMontenegroMoroccoMozambiqueMyanmarNamibiaNepalNetherlandsNew ZealandNicaraguaNigerNigeriaNorth AmericaNorwayOECD membersOmanOther small statesPacific island small statesPakistanPanamaPapua New GuineaParaguayPeruPhilippinesPolandPortugalPost-demographic dividendPre-demographic dividendQatarRomaniaRussian FederationRwandaSamoaSao Tome and PrincipeSaudi ArabiaSenegalSerbiaSeychellesSierra LeoneSingaporeSlovak RepublicSloveniaSmall statesSolomon IslandsSouth AfricaSouth AsiaSouth Asia (IDA & IBRD)South SudanSpainSri LankaSt. Kitts and NevisSt. LuciaSt. Vincent and the GrenadinesSub-Saharan Africa Sub-Saharan Africa (excluding high income)Sub-Saharan Africa (IDA & IBRD countries)SudanSurinameSwazilandSwedenSwitzerlandSyrian Arab RepublicTajikistanTanzaniaThailandTimor-LesteTogoTongaTrinidad and TobagoTunisiaTurkeyUgandaUkraineUnited Arab EmiratesUnited KingdomUnited StatesUpper middle incomeUruguayVanuatuVenezuela, RBVietnamWest Bank and GazaWorldYemen, Rep.ZambiaZimbabwe línea de tiempo (timeline):
En esta escala de tiempo se presenta un gráfico de 1961 y 2016 de Korea, Rep.. Los datos de 1960 están ausentes. El número de observaciones reales por fecha: 56.
Fuente (nombre):
Indicadores del desarrollo mundial
Fuente (organización):
International Monetary Fund, International Financial Statistics and data files, and World Bank and OECD GDP estimates.
Categorías:
Financial Sector, Private Sector
Se ha actualizado:
23 abr 2017 año
Los indicadores de los cambios de valor en los últimos años
Mínimo:
5.841
1 ene 1961 año
Máximo:
148.34
1 ene 2009 año
A la fecha de observación
Valor
Cambio absoluto
El cambio con respecto al valor anterior
1 ene 1961 año
5.841
+5.841
0.0%
1 ene 1962 año
12.344
+6.503
111.34%
1 ene 1963 año
13.032
+0.687
5.57%
1 ene 1964 año
10.886
-2.146
-16.46%
1 ene 1965 año
9.093
-1.793
-16.47%
1 ene 1966 año
10.584
+1.49
16.39%
1 ene 1967 año
11.504
+0.921
8.7%
1 ene 1968 año
17.369
+5.864
50.97%
1 ene 1969 año
26.205
+8.837
50.88%
1 ene 1970 año
32.786
+6.581
25.11%
1 ene 1971 año
31.46
-1.326
-4.04%
1 ene 1972 año
33.211
+1.751
5.57%
1 ene 1973 año
32.757
-0.455
-1.37%
1 ene 1974 año
32.808
+0.051
0.16%
1 ene 1975 año
34.64
+1.832
5.58%
1 ene 1976 año
32.202
-2.438
-7.04%
1 ene 1977 año
29.343
-2.859
-8.88%
1 ene 1978 año
28.733
-0.611
-2.08%
1 ene 1979 año
31.431
+2.699
9.39%
1 ene 1980 año
34.031
+2.6
8.27%
1 ene 1981 año
38.941
+4.91
14.43%
1 ene 1982 año
39.017
+0.076
0.2%
1 ene 1983 año
42.452
+3.435
8.8%
1 ene 1984 año
42.376
-0.076
-0.18%
1 ene 1985 año
42.182
-0.194
-0.46%
1 ene 1986 año
44.753
+2.57
6.09%
1 ene 1987 año
44.057
-0.696
-1.55%
1 ene 1988 año
44.906
+0.849
1.93%
1 ene 1989 año
43.304
-1.601
-3.57%
1 ene 1990 año
48.278
+4.973
11.48%
1 ene 1991 año
50.526
+2.249
4.66%
1 ene 1992 año
50.109
-0.417
-0.83%
1 ene 1993 año
48.835
-1.274
-2.54%
1 ene 1994 año
48.843
+0.008
0.02%
1 ene 1995 año
49.866
+1.022
2.09%
1 ene 1996 año
49.237
-0.629
-1.26%
1 ene 1997 año
52.455
+3.218
6.54%
1 ene 1998 año
57.61
+5.154
9.83%
1 ene 1999 año
62.904
+5.295
9.19%
1 ene 2000 año
68.384
+5.48
8.71%
1 ene 2001 año
73.603
+5.219
7.63%
1 ene 2002 año
106.058
+32.454
44.09%
1 ene 2003 año
116.022
+9.965
9.4%
1 ene 2004 año
114.74
-1.282
-1.11%
1 ene 2005 año
109.776
-4.964
-4.33%
1 ene 2006 año
114.819
+5.043
4.59%
1 ene 2007 año
127.221
+12.403
10.8%
1 ene 2008 año
134.88
+7.659
6.02%
1 ene 2009 año
148.34
+13.461
9.98%
1 ene 2010 año
144.527
-3.814
-2.57%
1 ene 2011 año
135.928
-8.599
-5.95%
1 ene 2012 año
138.133
+2.206
1.62%
1 ene 2013 año
136.693
-1.44
-1.04%
1 ene 2014 año
134.908
-1.785
-1.31%
1 ene 2015 año
138.358
+3.45
2.56%
1 ene 2016 año
140.571
+2.212
1.6%
Ranking de los países por los datos estadísticos actuales


Comentarios: