29
/es/
es
AIzaSyAYiBZKx7MnpbEhh9jyipgxe19OcubqV5w
April 1, 2024
93668
Bulgaria
BGR
true
2
1
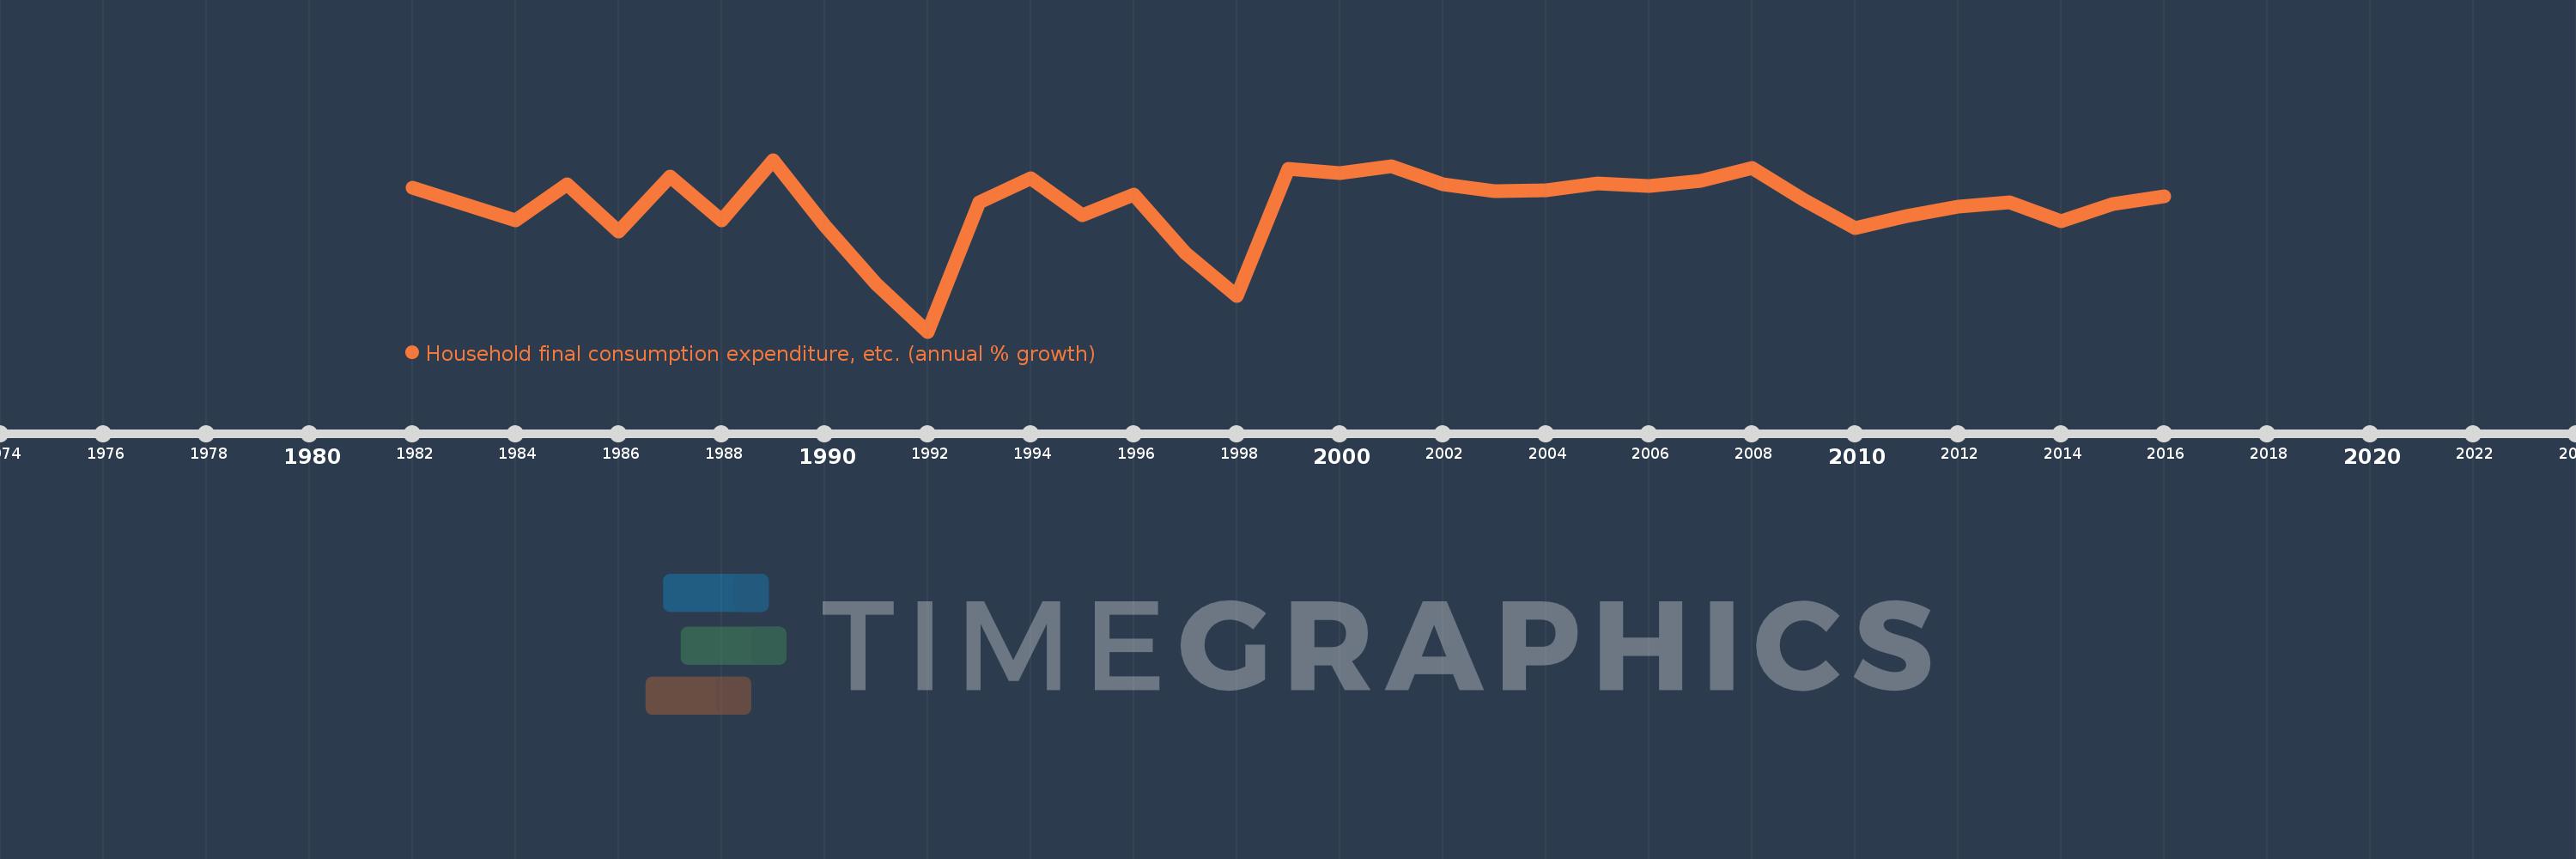
Household final consumption expenditure, etc. (annual % growth)
2016,2015,2014,2013,2012,2011,2010,2009,2008,2007,2006,2005,2004,2003,2002,2001,2000,1999,1998,1997,1996,1995,1994,1993,1992,1991,1990,1989,1988,1987,1986,1985,1984,1983,1982
Estas estadísticas en otros países:
AlbaniaAlgeriaAntigua and BarbudaArab WorldArgentinaArmeniaAustraliaAustriaAzerbaijanBahamas, TheBahrainBangladeshBarbadosBelarusBelgiumBelizeBeninBhutanBoliviaBosnia and HerzegovinaBotswanaBrazilBrunei DarussalamBulgariaBurkina FasoBurundiCabo VerdeCambodiaCameroonCanadaCaribbean small statesCentral Europe and the BalticsChadChileColombiaComorosCongo, Dem. Rep.Congo, Rep.Costa RicaCote d'IvoireCroatiaCubaCyprusCzech RepublicDenmarkDjiboutiDominican RepublicEarly-demographic dividendEast Asia & PacificEcuadorEgypt, Arab Rep.El SalvadorEquatorial GuineaEritreaEstoniaEthiopiaEuro areaEurope & Central AsiaEurope & Central Asia (excluding high income)Europe & Central Asia (IDA & IBRD countries)European UnionFijiFinlandFranceGabonGambia, TheGeorgiaGermanyGhanaGreeceGuatemalaGuineaGuinea-BissauHaitiHeavily indebted poor countries (HIPC)High incomeHondurasHong Kong SAR, ChinaHungaryIBRD onlyIcelandIDA & IBRD totalIDA blendIDA onlyIDA totalIndiaIndonesiaIran, Islamic Rep.IrelandIsraelItalyJamaicaJapanJordanKazakhstanKenyaKorea, Rep.KosovoKuwaitKyrgyz RepublicLao PDRLatin America & Caribbean Latin America & Caribbean (excluding high income)Latin America & the Caribbean (IDA & IBRD countries)LatviaLeast developed countries: UN classificationLebanonLiberiaLithuaniaLow & middle incomeLow incomeLower middle incomeLuxembourgMacao SAR, ChinaMacedonia, FYRMadagascarMalawiMalaysiaMaliMaltaMarshall IslandsMauritaniaMauritiusMexicoMiddle East & North AfricaMiddle East & North Africa (excluding high income)Middle East & North Africa (IDA & IBRD countries)Middle incomeMoldovaMongoliaMontenegroMoroccoMozambiqueNamibiaNepalNetherlandsNew ZealandNicaraguaNigerNigeriaNorth AmericaNorwayOECD membersOmanOther small statesPakistanPanamaPapua New GuineaParaguayPeruPhilippinesPolandPortugalPost-demographic dividendPre-demographic dividendPuerto RicoQatarRomaniaRussian FederationRwandaSaudi ArabiaSenegalSerbiaSeychellesSierra LeoneSingaporeSlovak RepublicSloveniaSmall statesSomaliaSouth AfricaSouth AsiaSouth Asia (IDA & IBRD)South SudanSpainSri LankaSub-Saharan Africa Sub-Saharan Africa (excluding high income)Sub-Saharan Africa (IDA & IBRD countries)SudanSurinameSwazilandSwedenSwitzerlandSyrian Arab RepublicTajikistanTanzaniaThailandTimor-LesteTogoTrinidad and TobagoTunisiaTurkeyTurkmenistanUgandaUkraineUnited Arab EmiratesUnited KingdomUnited StatesUpper middle incomeUruguayVanuatuVenezuela, RBVietnamWest Bank and GazaWorldZambiaZimbabwe línea de tiempo (timeline):
En esta escala de tiempo se presenta un gráfico de 1982 y 2016 de Bulgaria. Los datos de 1981 están ausentes. El número de observaciones reales por fecha: 35.
Fuente (nombre):
Indicadores del desarrollo mundial
Fuente (organización):
World Bank national accounts data, and OECD National Accounts data files.
Categorías:
Economy & Growth
Se ha actualizado:
23 abr 2017 año
Los indicadores de los cambios de valor en los últimos años
Mínimo:
-31.016
1 ene 1992 año
Máximo:
14.173
1 ene 1989 año
A la fecha de observación
Valor
Cambio absoluto
El cambio con respecto al valor anterior
1 ene 1982 año
6.825
+6.825
0.0%
1 ene 1983 año
2.616
-4.209
-61.67%
1 ene 1984 año
-1.717
-4.333
-165.63%
1 ene 1985 año
7.734
+9.451
-550.43%
1 ene 1986 año
-4.619
-12.353
-159.72%
1 ene 1987 año
9.721
+14.34
-310.46%
1 ene 1988 año
-1.762
-11.483
-118.13%
1 ene 1989 año
14.173
+15.935
-904.14%
1 ene 1990 año
-3.018
-17.19
-121.29%
1 ene 1991 año
-18.452
-15.434
511.48%
1 ene 1992 año
-31.016
-12.564
68.09%
1 ene 1993 año
3.063
+34.079
-109.87%
1 ene 1994 año
9.277
+6.215
202.9%
1 ene 1995 año
-0.292
-9.57
-103.15%
1 ene 1996 año
5.051
+5.343
-1.83 mil%
1 ene 1997 año
-10.352
-15.403
-304.95%
1 ene 1998 año
-21.688
-11.336
109.5%
1 ene 1999 año
11.875
+33.563
-154.75%
1 ene 2000 año
10.572
-1.303
-10.98%
1 ene 2001 año
12.505
+1.933
18.28%
1 ene 2002 año
7.822
-4.683
-37.45%
1 ene 2003 año
5.85
-1.972
-25.21%
1 ene 2004 año
6.078
+0.228
3.9%
1 ene 2005 año
7.923
+1.845
30.35%
1 ene 2006 año
7.387
-0.536
-6.76%
1 ene 2007 año
8.549
+1.161
15.72%
1 ene 2008 año
12.019
+3.471
40.6%
1 ene 2009 año
3.6
-8.419
-70.05%
1 ene 2010 año
-3.835
-7.435
-206.54%
1 ene 2011 año
-0.605
+3.23
-84.21%
1 ene 2012 año
1.958
+2.564
-423.48%
1 ene 2013 año
2.926
+0.968
49.42%
1 ene 2014 año
-2.073
-4.999
-170.82%
1 ene 2015 año
2.637
+4.71
-227.25%
1 ene 2016 año
4.489
+1.852
70.22%
Ranking de los países por los datos estadísticos actuales


Comentarios: