29
/es/
es
AIzaSyAYiBZKx7MnpbEhh9jyipgxe19OcubqV5w
April 1, 2024
268086
Tunisia
TUN
true
2
1
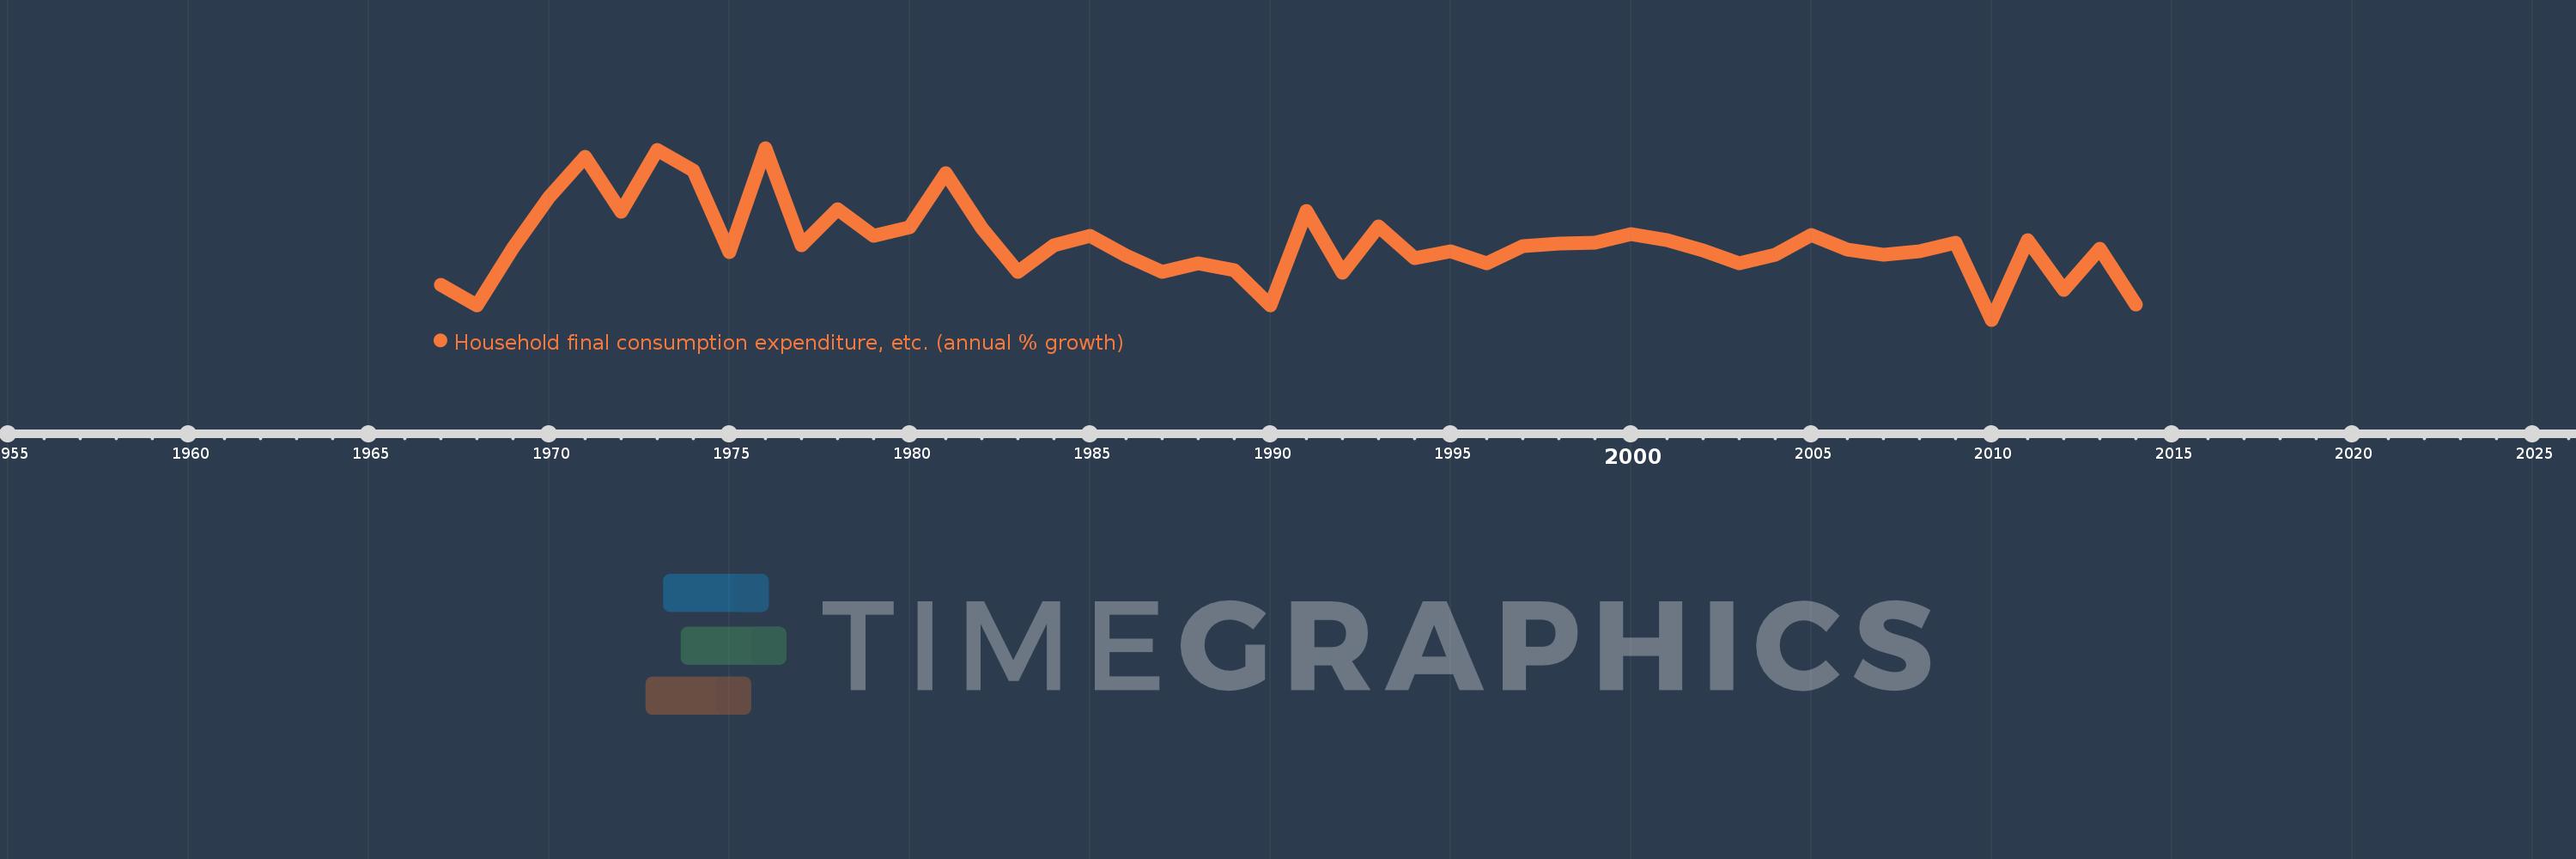
Household final consumption expenditure, etc. (annual % growth)
2014,2013,2012,2011,2010,2009,2008,2007,2006,2005,2004,2003,2002,2001,2000,1999,1998,1997,1996,1995,1994,1993,1992,1991,1990,1989,1988,1987,1986,1985,1984,1983,1982,1981,1980,1979,1978,1977,1976,1975,1974,1973,1972,1971,1970,1969,1968,1967
Estas estadísticas en otros países:
AlbaniaAlgeriaAntigua and BarbudaArab WorldArgentinaArmeniaAustraliaAustriaAzerbaijanBahamas, TheBahrainBangladeshBarbadosBelarusBelgiumBelizeBeninBhutanBoliviaBosnia and HerzegovinaBotswanaBrazilBrunei DarussalamBulgariaBurkina FasoBurundiCabo VerdeCambodiaCameroonCanadaCaribbean small statesCentral Europe and the BalticsChadChileColombiaComorosCongo, Dem. Rep.Congo, Rep.Costa RicaCote d'IvoireCroatiaCubaCyprusCzech RepublicDenmarkDjiboutiDominican RepublicEarly-demographic dividendEast Asia & PacificEcuadorEgypt, Arab Rep.El SalvadorEquatorial GuineaEritreaEstoniaEthiopiaEuro areaEurope & Central AsiaEurope & Central Asia (excluding high income)Europe & Central Asia (IDA & IBRD countries)European UnionFijiFinlandFranceGabonGambia, TheGeorgiaGermanyGhanaGreeceGuatemalaGuineaGuinea-BissauHaitiHeavily indebted poor countries (HIPC)High incomeHondurasHong Kong SAR, ChinaHungaryIBRD onlyIcelandIDA & IBRD totalIDA blendIDA onlyIDA totalIndiaIndonesiaIran, Islamic Rep.IrelandIsraelItalyJamaicaJapanJordanKazakhstanKenyaKorea, Rep.KosovoKuwaitKyrgyz RepublicLao PDRLatin America & Caribbean Latin America & Caribbean (excluding high income)Latin America & the Caribbean (IDA & IBRD countries)LatviaLeast developed countries: UN classificationLebanonLiberiaLithuaniaLow & middle incomeLow incomeLower middle incomeLuxembourgMacao SAR, ChinaMacedonia, FYRMadagascarMalawiMalaysiaMaliMaltaMarshall IslandsMauritaniaMauritiusMexicoMiddle East & North AfricaMiddle East & North Africa (excluding high income)Middle East & North Africa (IDA & IBRD countries)Middle incomeMoldovaMongoliaMontenegroMoroccoMozambiqueNamibiaNepalNetherlandsNew ZealandNicaraguaNigerNigeriaNorth AmericaNorwayOECD membersOmanOther small statesPakistanPanamaPapua New GuineaParaguayPeruPhilippinesPolandPortugalPost-demographic dividendPre-demographic dividendPuerto RicoQatarRomaniaRussian FederationRwandaSaudi ArabiaSenegalSerbiaSeychellesSierra LeoneSingaporeSlovak RepublicSloveniaSmall statesSomaliaSouth AfricaSouth AsiaSouth Asia (IDA & IBRD)South SudanSpainSri LankaSub-Saharan Africa Sub-Saharan Africa (excluding high income)Sub-Saharan Africa (IDA & IBRD countries)SudanSurinameSwazilandSwedenSwitzerlandSyrian Arab RepublicTajikistanTanzaniaThailandTimor-LesteTogoTrinidad and TobagoTunisiaTurkeyTurkmenistanUgandaUkraineUnited Arab EmiratesUnited KingdomUnited StatesUpper middle incomeUruguayVanuatuVenezuela, RBVietnamWest Bank and GazaWorldZambiaZimbabwe línea de tiempo (timeline):
En esta escala de tiempo se presenta un gráfico de 1967 y 2014 de Tunisia. Los datos de 1966 están ausentes. El número de observaciones reales por fecha: 48.
Fuente (nombre):
Indicadores del desarrollo mundial
Fuente (organización):
World Bank national accounts data, and OECD National Accounts data files.
Categorías:
Economy & Growth
Se ha actualizado:
23 abr 2017 año
Los indicadores de los cambios de valor en los últimos años
Mínimo:
-2.95
1 ene 2010 año
Máximo:
14.524
1 ene 1976 año
A la fecha de observación
Valor
Cambio absoluto
El cambio con respecto al valor anterior
1 ene 1967 año
0.609
+0.609
0.0%
1 ene 1968 año
-1.451
-2.06
-338.38%
1 ene 1969 año
4.344
+5.795
-399.38%
1 ene 1970 año
9.523
+5.179
119.21%
1 ene 1971 año
13.624
+4.101
43.07%
1 ene 1972 año
8.014
-5.61
-41.18%
1 ene 1973 año
14.325
+6.31
78.73%
1 ene 1974 año
12.236
-2.089
-14.58%
1 ene 1975 año
3.907
-8.329
-68.07%
1 ene 1976 año
14.524
+10.617
271.71%
1 ene 1977 año
4.666
-9.858
-67.88%
1 ene 1978 año
8.331
+3.665
78.56%
1 ene 1979 año
5.59
-2.741
-32.9%
1 ene 1980 año
6.497
+0.908
16.24%
1 ene 1981 año
11.921
+5.423
83.47%
1 ene 1982 año
6.364
-5.557
-46.62%
1 ene 1983 año
1.891
-4.473
-70.29%
1 ene 1984 año
4.618
+2.728
144.25%
1 ene 1985 año
5.552
+0.934
20.22%
1 ene 1986 año
3.548
-2.005
-36.1%
1 ene 1987 año
1.941
-1.606
-45.28%
1 ene 1988 año
2.815
+0.874
45.0%
1 ene 1989 año
2.12
-0.695
-24.69%
1 ene 1990 año
-1.483
-3.604
-169.97%
1 ene 1991 año
8.14
+9.624
-648.74%
1 ene 1992 año
1.86
-6.281
-77.15%
1 ene 1993 año
6.542
+4.682
251.79%
1 ene 1994 año
3.321
-3.221
-49.24%
1 ene 1995 año
4.011
+0.69
20.77%
1 ene 1996 año
2.766
-1.245
-31.03%
1 ene 1997 año
4.56
+1.793
64.83%
1 ene 1998 año
4.839
+0.279
6.13%
1 ene 1999 año
4.912
+0.074
1.52%
1 ene 2000 año
5.759
+0.847
17.24%
1 ene 2001 año
5.177
-0.582
-10.11%
1 ene 2002 año
4.083
-1.094
-21.13%
1 ene 2003 año
2.775
-1.308
-32.04%
1 ene 2004 año
3.676
+0.901
32.46%
1 ene 2005 año
5.691
+2.015
54.81%
1 ene 2006 año
4.155
-1.536
-27.0%
1 ene 2007 año
3.661
-0.493
-11.87%
1 ene 2008 año
4.035
+0.374
10.21%
1 ene 2009 año
4.865
+0.83
20.56%
1 ene 2010 año
-2.95
-7.815
-160.64%
1 ene 2011 año
5.188
+8.138
-275.83%
1 ene 2012 año
0.042
-5.146
-99.19%
1 ene 2013 año
4.288
+4.246
10.12 mil%
1 ene 2014 año
-1.421
-5.709
-133.14%
Ranking de los países por los datos estadísticos actuales


Comentarios: