29
/es/
es
AIzaSyAYiBZKx7MnpbEhh9jyipgxe19OcubqV5w
April 1, 2024
90779
Brazil
BRA
true
2
1
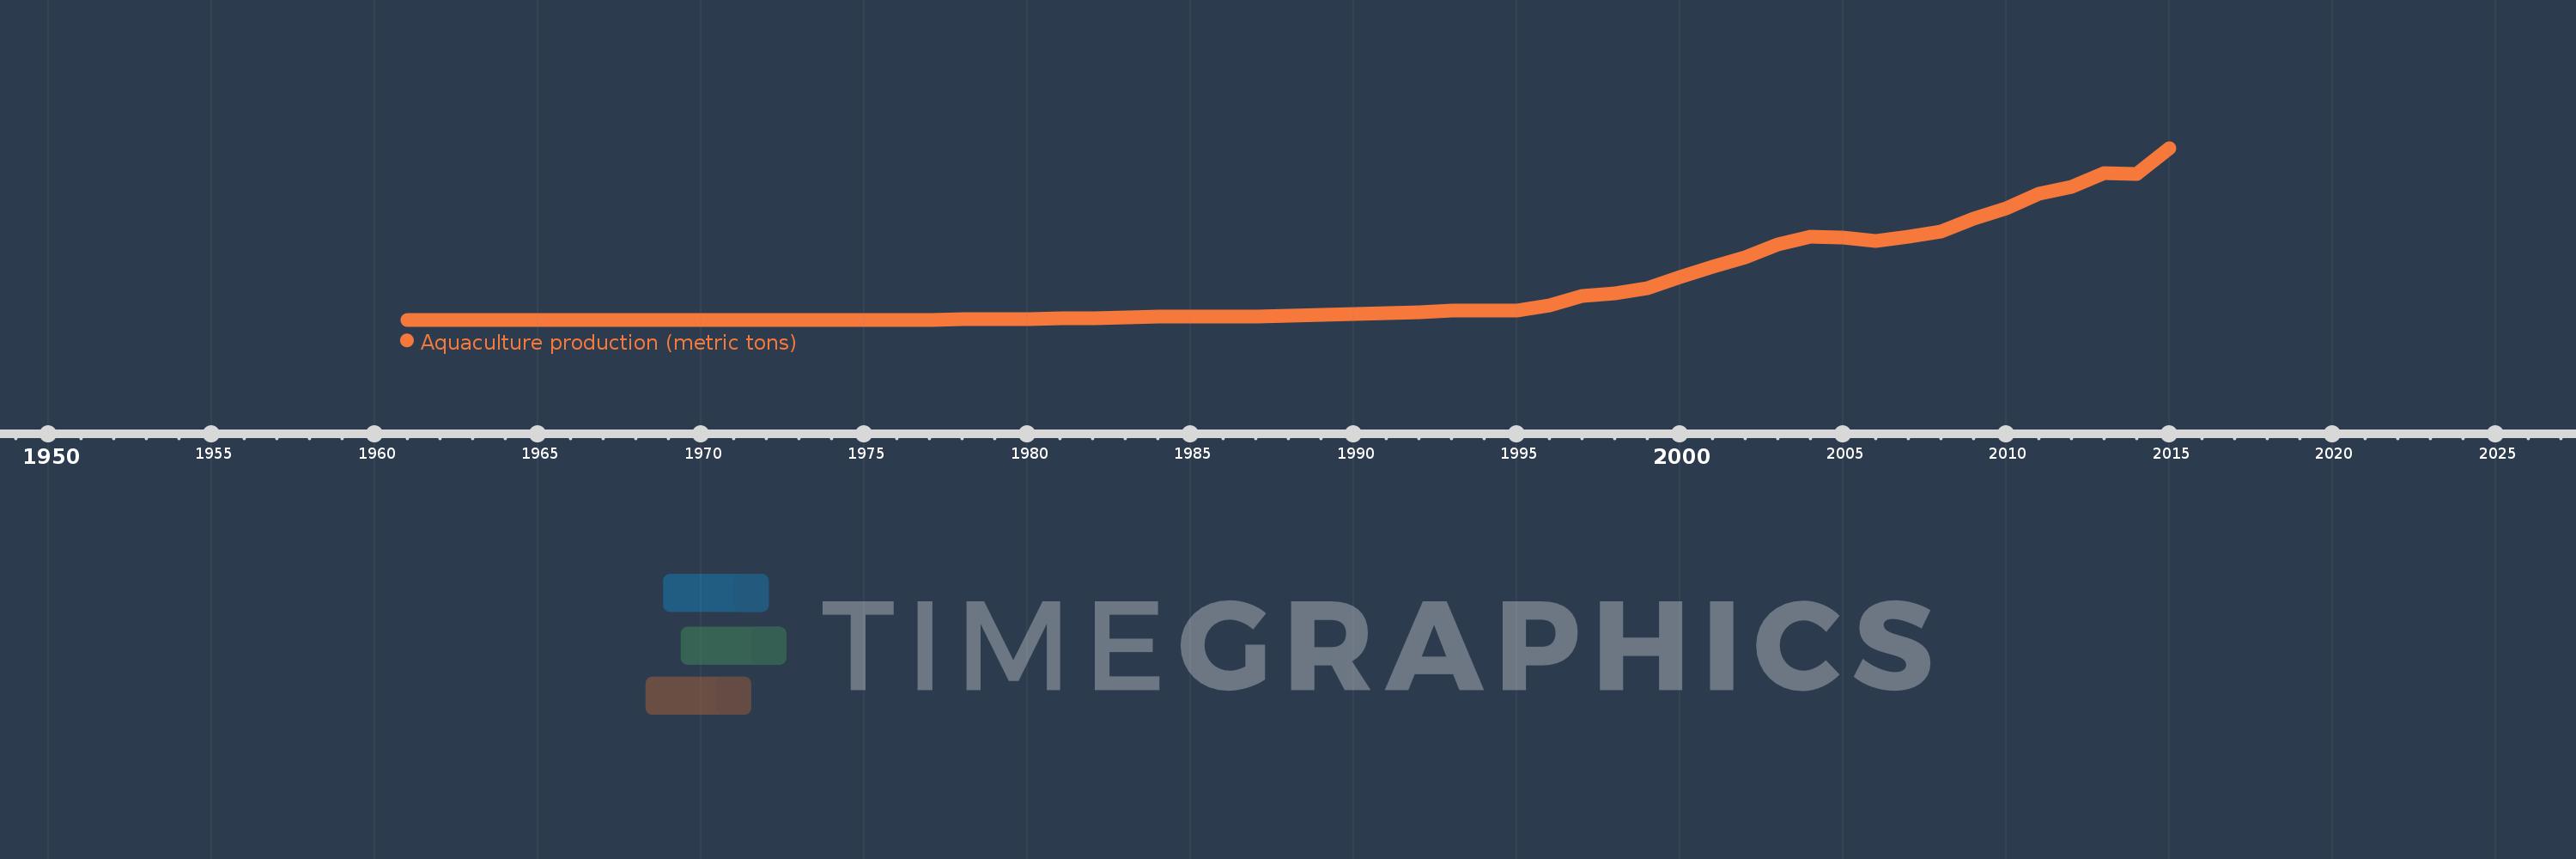
Aquaculture production (metric tons)
2015,2014,2013,2012,2011,2010,2009,2008,2007,2006,2005,2004,2003,2002,2001,2000,1999,1998,1997,1996,1995,1994,1993,1992,1991,1990,1989,1988,1987,1986,1985,1984,1983,1982,1981,1980,1979,1978,1977,1976,1975,1974,1973,1972,1971,1970,1969,1968,1967,1966,1965,1964,1963,1962,1961
Estas estadísticas en otros países:
AfghanistanAlbaniaAlgeriaAmerican SamoaAngolaArab WorldArgentinaArmeniaArubaAustraliaAustriaAzerbaijanBahamas, TheBahrainBangladeshBarbadosBelarusBelgiumBelizeBeninBhutanBoliviaBosnia and HerzegovinaBrazilBrunei DarussalamBulgariaBurkina FasoBurundiCambodiaCameroonCanadaCaribbean small statesCentral African RepublicCentral Europe and the BalticsChadChannel IslandsChileChinaColombiaCongo, Dem. Rep.Congo, Rep.Costa RicaCote d'IvoireCroatiaCubaCyprusCzech RepublicDenmarkDominicaDominican RepublicEarly-demographic dividendEast Asia & PacificEast Asia & Pacific (excluding high income)East Asia & Pacific (IDA & IBRD countries)EcuadorEgypt, Arab Rep.El SalvadorEquatorial GuineaEritreaEstoniaEthiopiaEuro areaEurope & Central AsiaEurope & Central Asia (excluding high income)Europe & Central Asia (IDA & IBRD countries)European UnionFaroe IslandsFijiFinlandFragile and conflict affected situationsFranceFrench PolynesiaGabonGambia, TheGeorgiaGermanyGhanaGreeceGrenadaGuamGuatemalaGuineaGuyanaHaitiHeavily indebted poor countries (HIPC)High incomeHondurasHong Kong SAR, ChinaHungaryIBRD onlyIcelandIDA & IBRD totalIDA blendIDA onlyIDA totalIndiaIndonesiaIran, Islamic Rep.IraqIrelandIsraelItalyJamaicaJapanJordanKazakhstanKenyaKiribatiKorea, Dem. People’s Rep.Korea, Rep.KuwaitKyrgyz RepublicLao PDRLate-demographic dividendLatin America & Caribbean Latin America & Caribbean (excluding high income)Latin America & the Caribbean (IDA & IBRD countries)LatviaLeast developed countries: UN classificationLebanonLesothoLiberiaLibyaLithuaniaLow & middle incomeLow incomeLower middle incomeMacedonia, FYRMadagascarMalawiMalaysiaMaliMaltaMarshall IslandsMauritiusMexicoMicronesia, Fed. Sts.Middle East & North AfricaMiddle East & North Africa (excluding high income)Middle East & North Africa (IDA & IBRD countries)Middle incomeMoldovaMontenegroMoroccoMozambiqueMyanmarNamibiaNauruNepalNetherlandsNew CaledoniaNew ZealandNicaraguaNigerNigeriaNorth AmericaNorthern Mariana IslandsNorwayOECD membersOmanOther small statesPacific island small statesPakistanPalauPanamaPapua New GuineaParaguayPeruPhilippinesPolandPortugalPost-demographic dividendPre-demographic dividendPuerto RicoQatarRomaniaRussian FederationRwandaSamoaSaudi ArabiaSenegalSerbiaSeychellesSierra LeoneSingaporeSlovak RepublicSloveniaSmall statesSolomon IslandsSouth AfricaSouth AsiaSouth Asia (IDA & IBRD)South SudanSpainSri LankaSt. Kitts and NevisSt. LuciaSub-Saharan Africa Sub-Saharan Africa (excluding high income)Sub-Saharan Africa (IDA & IBRD countries)SudanSurinameSwazilandSwedenSwitzerlandSyrian Arab RepublicTajikistanTanzaniaThailandTimor-LesteTogoTongaTrinidad and TobagoTunisiaTurkeyTurkmenistanTurks and Caicos IslandsTuvaluUgandaUkraineUnited Arab EmiratesUnited KingdomUnited StatesUpper middle incomeUruguayUzbekistanVanuatuVenezuela, RBVietnamVirgin Islands (U.S.)West Bank and GazaWorldYemen, Rep.ZambiaZimbabwe línea de tiempo (timeline):
En esta escala de tiempo se presenta un gráfico de 1961 y 2015 de Brazil. Los datos de 1960 están ausentes. El número de observaciones reales por fecha: 55.
Fuente (nombre):
Indicadores del desarrollo mundial
Fuente (organización):
Food and Agriculture Organization.
Categorías:
Environment
Se ha actualizado:
23 abr 2017 año
Los indicadores de los cambios de valor en los últimos años
Máximo:
562.533 mil
1 ene 2015 año
A la fecha de observación
Valor
Cambio absoluto
El cambio con respecto al valor anterior
1 ene 1961 año
0.0
0.0
0.0%
1 ene 1970 año
10.0
+10.0
%
1 ene 1971 año
19.0
+9.0
90.0%
1 ene 1972 año
27.0
+8.0
42.11%
1 ene 1973 año
50.0
+23.0
85.19%
1 ene 1974 año
93.0
+43.0
86.0%
1 ene 1975 año
158.0
+65.0
69.89%
1 ene 1976 año
286.0
+128.0
81.01%
1 ene 1977 año
433.0
+147.0
51.4%
1 ene 1978 año
780.0
+347.0
80.14%
1 ene 1979 año
1.132 mil
+352.0
45.13%
1 ene 1980 año
1.687 mil
+555.0
49.03%
1 ene 1981 año
3.737 mil
+2.05 mil
121.52%
1 ene 1982 año
5.794 mil
+2.057 mil
55.04%
1 ene 1983 año
7.586 mil
+1.792 mil
30.93%
1 ene 1984 año
9.168 mil
+1.582 mil
20.85%
1 ene 1985 año
10.7 mil
+1.532 mil
16.71%
1 ene 1986 año
10.873 mil
+173.0
1.62%
1 ene 1987 año
10.99 mil
+117.0
1.08%
1 ene 1988 año
13.14 mil
+2.15 mil
19.56%
1 ene 1989 año
15.559 mil
+2.419 mil
18.41%
1 ene 1990 año
18.17 mil
+2.611 mil
16.78%
1 ene 1991 año
20.49 mil
+2.32 mil
12.77%
1 ene 1992 año
23.39 mil
+2.9 mil
14.15%
1 ene 1993 año
29.82 mil
+6.43 mil
27.49%
1 ene 1994 año
30.39 mil
+570.0
1.91%
1 ene 1995 año
30.915 mil
+525.0
1.73%
1 ene 1996 año
46.202 mil
+15.287 mil
49.45%
1 ene 1997 año
77.69 mil
+31.488 mil
68.15%
1 ene 1998 año
87.676 mil
+9.986 mil
12.85%
1 ene 1999 año
103.915 mil
+16.239 mil
18.52%
1 ene 2000 año
140.657 mil
+36.742 mil
35.36%
1 ene 2001 año
172.45 mil
+31.793 mil
22.6%
1 ene 2002 año
205.568 mil
+33.118 mil
19.2%
1 ene 2003 año
247.678 mil
+42.11 mil
20.48%
1 ene 2004 año
273.268 mil
+25.59 mil
10.33%
1 ene 2005 año
269.699 mil
-3.569 mil
-1.31%
1 ene 2006 año
257.784 mil
-11.915 mil
-4.42%
1 ene 2007 año
271.697 mil
+13.913 mil
5.4%
1 ene 2008 año
289.048 mil
+17.351 mil
6.39%
1 ene 2009 año
331.553 mil
+42.505 mil
14.71%
1 ene 2010 año
365.127 mil
+33.574 mil
10.13%
1 ene 2011 año
411.777 mil
+46.65 mil
12.78%
1 ene 2012 año
436.084 mil
+24.307 mil
5.9%
1 ene 2013 año
480.88 mil
+44.796 mil
10.27%
1 ene 2014 año
477.752 mil
-3.128 mil
-0.65%
1 ene 2015 año
562.533 mil
+84.781 mil
17.75%
Ranking de los países por los datos estadísticos actuales


Comentarios: