29
/es/
es
AIzaSyAYiBZKx7MnpbEhh9jyipgxe19OcubqV5w
April 1, 2024
34770
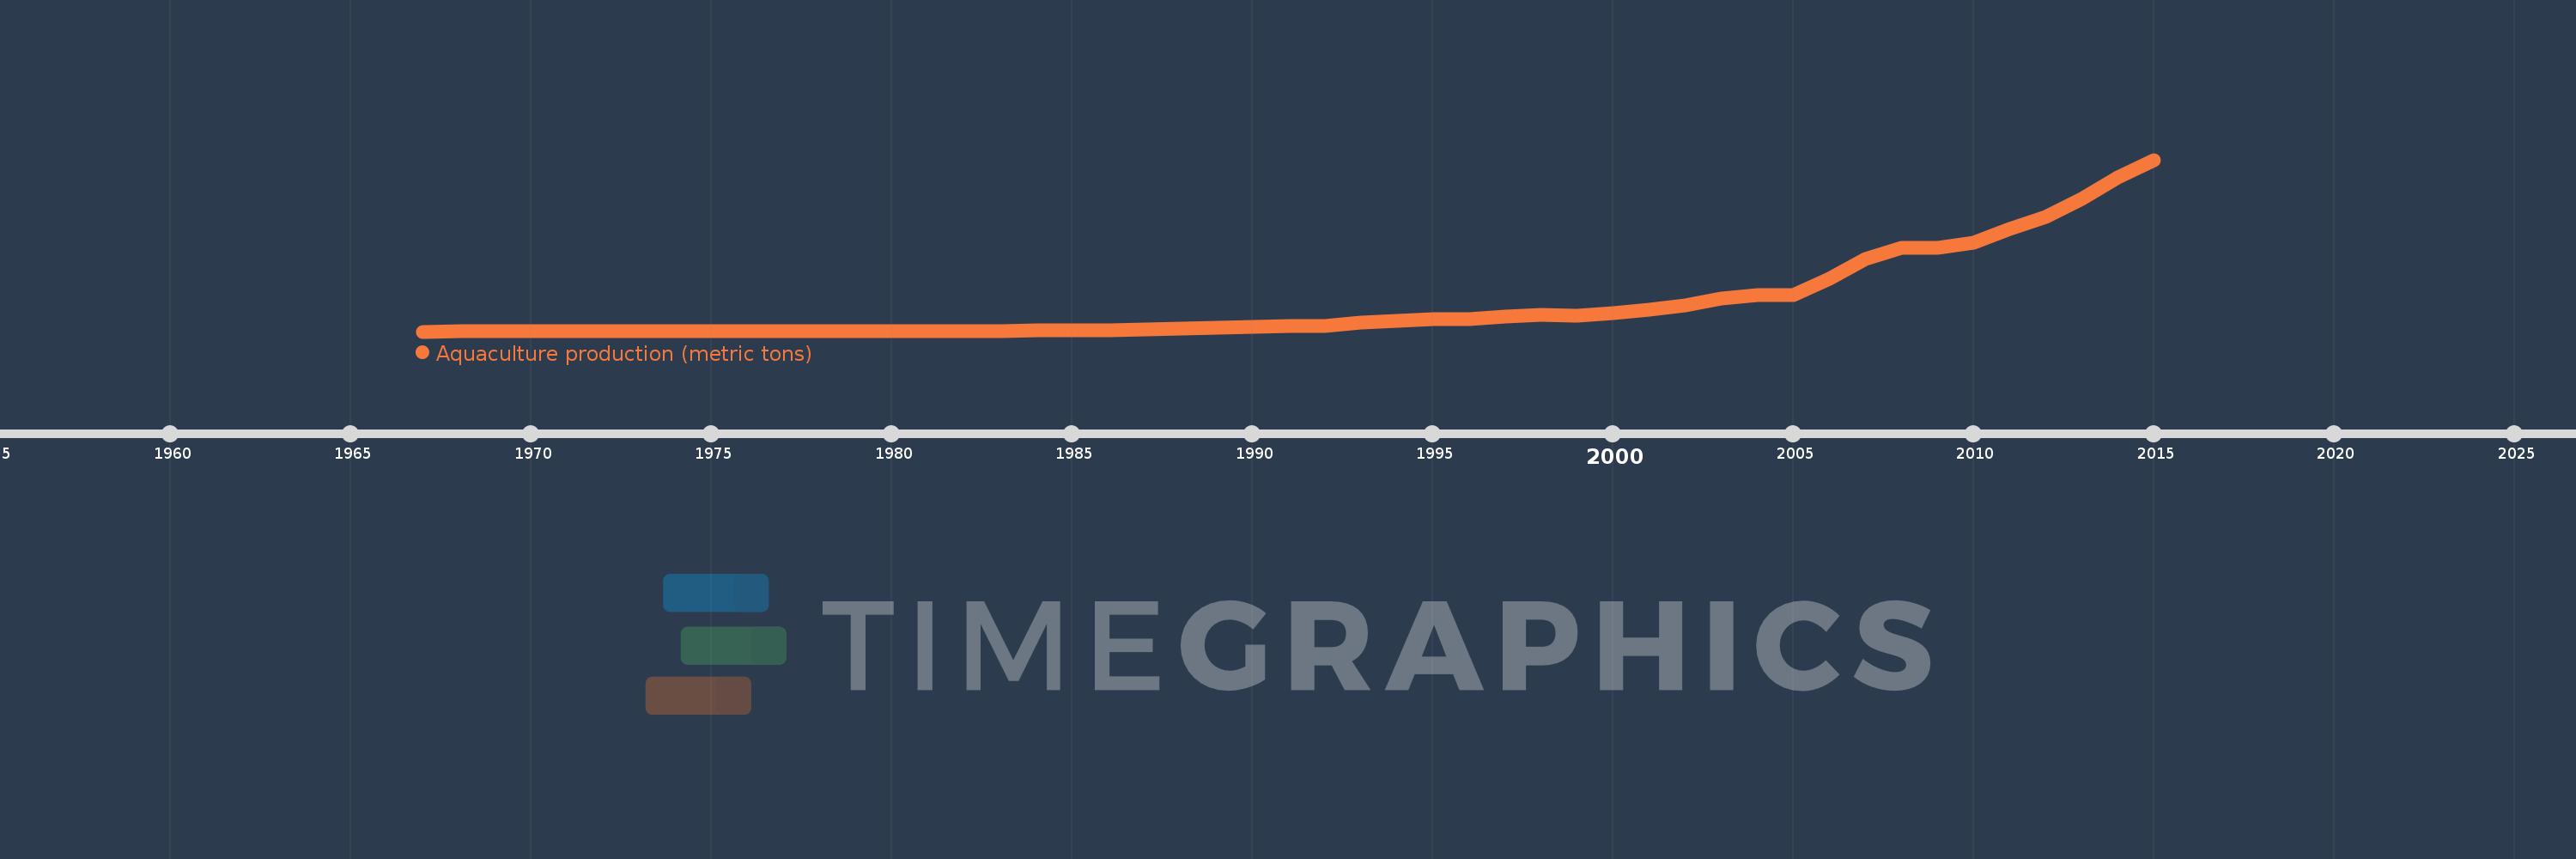
Heavily indebted poor countries (HIPC)
HPC
false
2
1
Aquaculture production (metric tons)
2015,2014,2013,2012,2011,2010,2009,2008,2007,2006,2005,2004,2003,2002,2001,2000,1999,1998,1997,1996,1995,1994,1993,1992,1991,1990,1989,1988,1987,1986,1985,1984,1983,1982,1981,1980,1979,1978,1977,1976,1975,1974,1973,1972,1971,1970,1969,1968,1967
Estas estadísticas en otros países:
AfghanistanAlbaniaAlgeriaAmerican SamoaAngolaArab WorldArgentinaArmeniaArubaAustraliaAustriaAzerbaijanBahamas, TheBahrainBangladeshBarbadosBelarusBelgiumBelizeBeninBhutanBoliviaBosnia and HerzegovinaBrazilBrunei DarussalamBulgariaBurkina FasoBurundiCambodiaCameroonCanadaCaribbean small statesCentral African RepublicCentral Europe and the BalticsChadChannel IslandsChileChinaColombiaCongo, Dem. Rep.Congo, Rep.Costa RicaCote d'IvoireCroatiaCubaCyprusCzech RepublicDenmarkDominicaDominican RepublicEarly-demographic dividendEast Asia & PacificEast Asia & Pacific (excluding high income)East Asia & Pacific (IDA & IBRD countries)EcuadorEgypt, Arab Rep.El SalvadorEquatorial GuineaEritreaEstoniaEthiopiaEuro areaEurope & Central AsiaEurope & Central Asia (excluding high income)Europe & Central Asia (IDA & IBRD countries)European UnionFaroe IslandsFijiFinlandFragile and conflict affected situationsFranceFrench PolynesiaGabonGambia, TheGeorgiaGermanyGhanaGreeceGrenadaGuamGuatemalaGuineaGuyanaHaitiHeavily indebted poor countries (HIPC)High incomeHondurasHong Kong SAR, ChinaHungaryIBRD onlyIcelandIDA & IBRD totalIDA blendIDA onlyIDA totalIndiaIndonesiaIran, Islamic Rep.IraqIrelandIsraelItalyJamaicaJapanJordanKazakhstanKenyaKiribatiKorea, Dem. People’s Rep.Korea, Rep.KuwaitKyrgyz RepublicLao PDRLate-demographic dividendLatin America & Caribbean Latin America & Caribbean (excluding high income)Latin America & the Caribbean (IDA & IBRD countries)LatviaLeast developed countries: UN classificationLebanonLesothoLiberiaLibyaLithuaniaLow & middle incomeLow incomeLower middle incomeMacedonia, FYRMadagascarMalawiMalaysiaMaliMaltaMarshall IslandsMauritiusMexicoMicronesia, Fed. Sts.Middle East & North AfricaMiddle East & North Africa (excluding high income)Middle East & North Africa (IDA & IBRD countries)Middle incomeMoldovaMontenegroMoroccoMozambiqueMyanmarNamibiaNauruNepalNetherlandsNew CaledoniaNew ZealandNicaraguaNigerNigeriaNorth AmericaNorthern Mariana IslandsNorwayOECD membersOmanOther small statesPacific island small statesPakistanPalauPanamaPapua New GuineaParaguayPeruPhilippinesPolandPortugalPost-demographic dividendPre-demographic dividendPuerto RicoQatarRomaniaRussian FederationRwandaSamoaSaudi ArabiaSenegalSerbiaSeychellesSierra LeoneSingaporeSlovak RepublicSloveniaSmall statesSolomon IslandsSouth AfricaSouth AsiaSouth Asia (IDA & IBRD)South SudanSpainSri LankaSt. Kitts and NevisSt. LuciaSub-Saharan Africa Sub-Saharan Africa (excluding high income)Sub-Saharan Africa (IDA & IBRD countries)SudanSurinameSwazilandSwedenSwitzerlandSyrian Arab RepublicTajikistanTanzaniaThailandTimor-LesteTogoTongaTrinidad and TobagoTunisiaTurkeyTurkmenistanTurks and Caicos IslandsTuvaluUgandaUkraineUnited Arab EmiratesUnited KingdomUnited StatesUpper middle incomeUruguayUzbekistanVanuatuVenezuela, RBVietnamVirgin Islands (U.S.)West Bank and GazaWorldYemen, Rep.ZambiaZimbabwe línea de tiempo (timeline):
En esta escala de tiempo se presenta un gráfico de 1967 y 2015 de Heavily indebted poor countries (HIPC). Los datos de 1966 están ausentes. El número de observaciones reales por fecha: 49.
Fuente (nombre):
Indicadores del desarrollo mundial
Fuente (organización):
Food and Agriculture Organization.
Categorías:
Environment
Se ha actualizado:
23 abr 2017 año
Los indicadores de los cambios de valor en los últimos años
Máximo:
328.339 mil
1 ene 2015 año
A la fecha de observación
Valor
Cambio absoluto
El cambio con respecto al valor anterior
1 ene 1967 año
4.0
+4.0
0.0%
1 ene 1968 año
10.0
+6.0
150.0%
1 ene 1969 año
20.0
+10.0
100.0%
1 ene 1970 año
106.0
+86.0
430.0%
1 ene 1971 año
254.0
+148.0
139.62%
1 ene 1972 año
282.0
+28.0
11.02%
1 ene 1973 año
402.0
+120.0
42.55%
1 ene 1974 año
428.0
+26.0
6.47%
1 ene 1975 año
343.0
-85.0
-19.86%
1 ene 1976 año
345.0
+2.0
0.58%
1 ene 1977 año
510.0
+165.0
47.83%
1 ene 1978 año
638.0
+128.0
25.1%
1 ene 1979 año
714.0
+76.0
11.91%
1 ene 1980 año
788.0
+74.0
10.36%
1 ene 1981 año
989.0
+201.0
25.51%
1 ene 1982 año
1.138 mil
+149.0
15.07%
1 ene 1983 año
1.4 mil
+262.0
23.02%
1 ene 1984 año
1.802 mil
+402.0
28.71%
1 ene 1985 año
2.922 mil
+1.12 mil
62.15%
1 ene 1986 año
2.86 mil
-62.0
-2.12%
1 ene 1987 año
4.317 mil
+1.457 mil
50.94%
1 ene 1988 año
5.913 mil
+1.596 mil
36.97%
1 ene 1989 año
7.002 mil
+1.089 mil
18.42%
1 ene 1990 año
9.072 mil
+2.07 mil
29.56%
1 ene 1991 año
9.959 mil
+887.0
9.78%
1 ene 1992 año
11.427 mil
+1.468 mil
14.74%
1 ene 1993 año
17.036 mil
+5.609 mil
49.09%
1 ene 1994 año
20.942 mil
+3.906 mil
22.93%
1 ene 1995 año
23.055 mil
+2.113 mil
10.09%
1 ene 1996 año
24.516 mil
+1.461 mil
6.34%
1 ene 1997 año
29.246 mil
+4.73 mil
19.29%
1 ene 1998 año
32.54 mil
+3.294 mil
11.26%
1 ene 1999 año
30.434 mil
-2.106 mil
-6.47%
1 ene 2000 año
35.014 mil
+4.58 mil
15.05%
1 ene 2001 año
41.677 mil
+6.663 mil
19.03%
1 ene 2002 año
50.063 mil
+8.386 mil
20.12%
1 ene 2003 año
63.874 mil
+13.811 mil
27.59%
1 ene 2004 año
69.893 mil
+6.019 mil
9.42%
1 ene 2005 año
70.476 mil
+583.0
0.83%
1 ene 2006 año
101.612 mil
+31.136 mil
44.18%
1 ene 2007 año
138.714 mil
+37.102 mil
36.51%
1 ene 2008 año
160.056 mil
+21.342 mil
15.39%
1 ene 2009 año
160.492 mil
+436.05
0.27%
1 ene 2010 año
170.122 mil
+9.63 mil
6.0%
1 ene 2011 año
195.429 mil
+25.307 mil
14.88%
1 ene 2012 año
218.78 mil
+23.351 mil
11.95%
1 ene 2013 año
253.056 mil
+34.276 mil
15.67%
1 ene 2014 año
295.085 mil
+42.029 mil
16.61%
1 ene 2015 año
328.339 mil
+33.254 mil
11.27%
Ranking de los países por los datos estadísticos actuales


Comentarios: