29
/es/
es
AIzaSyAYiBZKx7MnpbEhh9jyipgxe19OcubqV5w
April 1, 2024
90745
Brazil
BRA
true
2
1
Agricultural land (% of land area)
2015,2014,2013,2012,2011,2010,2009,2008,2007,2006,2005,2004,2003,2002,2001,2000,1999,1998,1997,1996,1995,1994,1993,1992,1991,1990,1989,1988,1987,1986,1985,1984,1983,1982,1981,1980,1979,1978,1977,1976,1975,1974,1973,1972,1971,1970,1969,1968,1967,1966,1965,1964,1963,1962
Estas estadísticas en otros países:
AfghanistanAlbaniaAlgeriaAmerican SamoaAndorraAngolaAntigua and BarbudaArab WorldArgentinaArmeniaArubaAustraliaAustriaAzerbaijanBahamas, TheBahrainBangladeshBarbadosBelarusBelgiumBelizeBeninBermudaBhutanBoliviaBosnia and HerzegovinaBotswanaBrazilBritish Virgin IslandsBrunei DarussalamBulgariaBurkina FasoBurundiCabo VerdeCambodiaCameroonCanadaCaribbean small statesCayman IslandsCentral African RepublicCentral Europe and the BalticsChadChannel IslandsChileChinaColombiaComorosCongo, Dem. Rep.Congo, Rep.Costa RicaCote d'IvoireCroatiaCubaCyprusCzech RepublicDenmarkDjiboutiDominicaDominican RepublicEarly-demographic dividendEast Asia & PacificEast Asia & Pacific (excluding high income)East Asia & Pacific (IDA & IBRD countries)EcuadorEgypt, Arab Rep.El SalvadorEquatorial GuineaEritreaEstoniaEthiopiaEuro areaEurope & Central AsiaEurope & Central Asia (excluding high income)Europe & Central Asia (IDA & IBRD countries)European UnionFaroe IslandsFijiFinlandFragile and conflict affected situationsFranceFrench PolynesiaGabonGambia, TheGeorgiaGermanyGhanaGreeceGreenlandGrenadaGuamGuatemalaGuineaGuinea-BissauGuyanaHaitiHeavily indebted poor countries (HIPC)High incomeHondurasHong Kong SAR, ChinaHungaryIBRD onlyIcelandIDA & IBRD totalIDA blendIDA onlyIDA totalIndiaIndonesiaIran, Islamic Rep.IraqIrelandIsle of ManIsraelItalyJamaicaJapanJordanKazakhstanKenyaKiribatiKorea, Dem. People’s Rep.Korea, Rep.KosovoKuwaitKyrgyz RepublicLao PDRLate-demographic dividendLatin America & Caribbean Latin America & Caribbean (excluding high income)Latin America & the Caribbean (IDA & IBRD countries)LatviaLeast developed countries: UN classificationLebanonLesothoLiberiaLibyaLiechtensteinLithuaniaLow & middle incomeLow incomeLower middle incomeLuxembourgMacedonia, FYRMadagascarMalawiMalaysiaMaldivesMaliMaltaMarshall IslandsMauritaniaMauritiusMexicoMicronesia, Fed. Sts.Middle East & North AfricaMiddle East & North Africa (excluding high income)Middle East & North Africa (IDA & IBRD countries)Middle incomeMoldovaMongoliaMontenegroMoroccoMozambiqueMyanmarNamibiaNauruNepalNetherlandsNew CaledoniaNew ZealandNicaraguaNigerNigeriaNorth AmericaNorthern Mariana IslandsNorwayOECD membersOmanOther small statesPacific island small statesPakistanPalauPanamaPapua New GuineaParaguayPeruPhilippinesPolandPortugalPost-demographic dividendPre-demographic dividendPuerto RicoQatarRomaniaRussian FederationRwandaSamoaSan MarinoSao Tome and PrincipeSaudi ArabiaSenegalSerbiaSeychellesSierra LeoneSingaporeSlovak RepublicSloveniaSmall statesSolomon IslandsSomaliaSouth AfricaSouth AsiaSouth Asia (IDA & IBRD)SpainSri LankaSt. Kitts and NevisSt. LuciaSt. Vincent and the GrenadinesSub-Saharan Africa Sub-Saharan Africa (excluding high income)Sub-Saharan Africa (IDA & IBRD countries)SudanSurinameSwazilandSwedenSwitzerlandSyrian Arab RepublicTajikistanTanzaniaThailandTimor-LesteTogoTongaTrinidad and TobagoTunisiaTurkeyTurkmenistanTurks and Caicos IslandsTuvaluUgandaUkraineUnited Arab EmiratesUnited KingdomUnited StatesUpper middle incomeUruguayUzbekistanVanuatuVenezuela, RBVietnamVirgin Islands (U.S.)West Bank and GazaWorldYemen, Rep.ZambiaZimbabwe línea de tiempo (timeline):
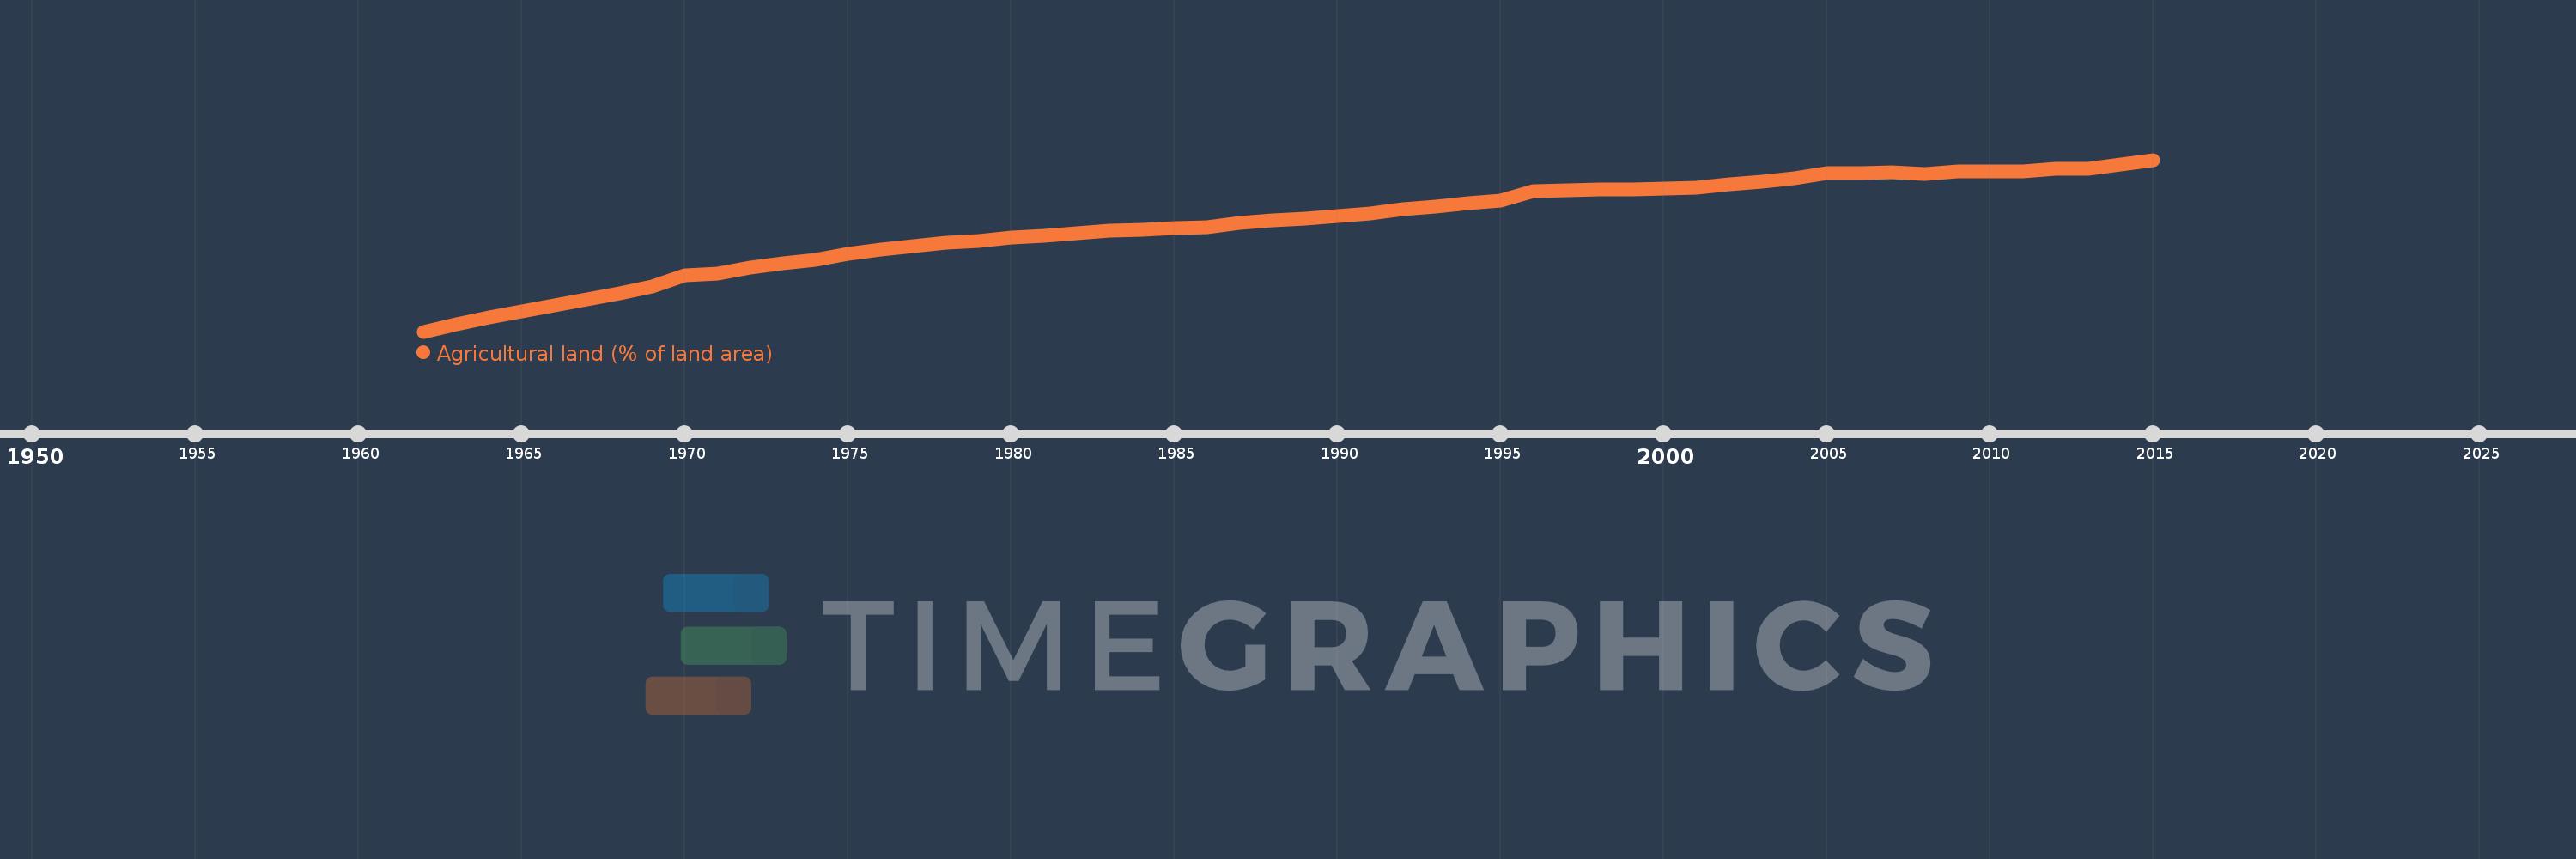
En esta escala de tiempo se presenta un gráfico de 1962 y 2015 de Brazil. Los datos de 1961 están ausentes. El número de observaciones reales por fecha: 54.
Fuente (nombre):
Indicadores del desarrollo mundial
Fuente (organización):
Food and Agriculture Organization, electronic files and web site.
Categorías:
Agriculture & Rural Development, Climate Change, Environment
Se ha actualizado:
23 abr 2017 año
Los indicadores de los cambios de valor en los últimos años
Mínimo:
18.01
1 ene 1962 año
Máximo:
33.81
1 ene 2015 año
A la fecha de observación
Valor
Cambio absoluto
El cambio con respecto al valor anterior
1 ene 1962 año
18.01
+18.01
0.0%
1 ene 1963 año
18.654
+0.644
3.58%
1 ene 1964 año
19.324
+0.67
3.59%
1 ene 1965 año
19.866
+0.542
2.8%
1 ene 1966 año
20.387
+0.521
2.62%
1 ene 1967 año
20.949
+0.562
2.76%
1 ene 1968 año
21.487
+0.538
2.57%
1 ene 1969 año
22.161
+0.674
3.14%
1 ene 1970 año
23.184
+1.024
4.62%
1 ene 1971 año
23.378
+0.194
0.84%
1 ene 1972 año
23.885
+0.507
2.17%
1 ene 1973 año
24.268
+0.383
1.61%
1 ene 1974 año
24.63
+0.362
1.49%
1 ene 1975 año
25.13
+0.5
2.03%
1 ene 1976 año
25.534
+0.404
1.61%
1 ene 1977 año
25.844
+0.31
1.21%
1 ene 1978 año
26.148
+0.304
1.18%
1 ene 1979 año
26.326
+0.178
0.68%
1 ene 1980 año
26.622
+0.296
1.12%
1 ene 1981 año
26.833
+0.211
0.79%
1 ene 1982 año
27.018
+0.185
0.69%
1 ene 1983 año
27.295
+0.277
1.02%
1 ene 1984 año
27.377
+0.082
0.3%
1 ene 1985 año
27.509
+0.132
0.48%
1 ene 1986 año
27.643
+0.134
0.49%
1 ene 1987 año
28.003
+0.361
1.3%
1 ene 1988 año
28.211
+0.208
0.74%
1 ene 1989 año
28.438
+0.227
0.8%
1 ene 1990 año
28.647
+0.209
0.73%
1 ene 1991 año
28.907
+0.26
0.91%
1 ene 1992 año
29.306
+0.399
1.38%
1 ene 1993 año
29.517
+0.212
0.72%
1 ene 1994 año
29.847
+0.329
1.12%
1 ene 1995 año
30.081
+0.234
0.78%
1 ene 1996 año
30.925
+0.844
2.81%
1 ene 1997 año
30.99
+0.065
0.21%
1 ene 1998 año
31.055
+0.065
0.21%
1 ene 1999 año
31.121
+0.065
0.21%
1 ene 2000 año
31.198
+0.077
0.25%
1 ene 2001 año
31.276
+0.077
0.25%
1 ene 2002 año
31.522
+0.246
0.79%
1 ene 2003 año
31.809
+0.288
0.91%
1 ene 2004 año
32.121
+0.311
0.98%
1 ene 2005 año
32.559
+0.438
1.36%
1 ene 2006 año
32.595
+0.036
0.11%
1 ene 2007 año
32.637
+0.042
0.13%
1 ene 2008 año
32.5
-0.137
-0.42%
1 ene 2009 año
32.723
+0.223
0.69%
1 ene 2010 año
32.727
+0.005
0.01%
1 ene 2011 año
32.718
-0.009
-0.03%
1 ene 2012 año
32.947
+0.229
0.7%
1 ene 2013 año
32.975
+0.028
0.08%
1 ene 2014 año
33.358
+0.383
1.16%
1 ene 2015 año
33.81
+0.452
1.36%
Ranking de los países por los datos estadísticos actuales


Comentarios: