29
/es/
es
AIzaSyAYiBZKx7MnpbEhh9jyipgxe19OcubqV5w
April 1, 2024
23883
Arab World
ARB
false
2
1
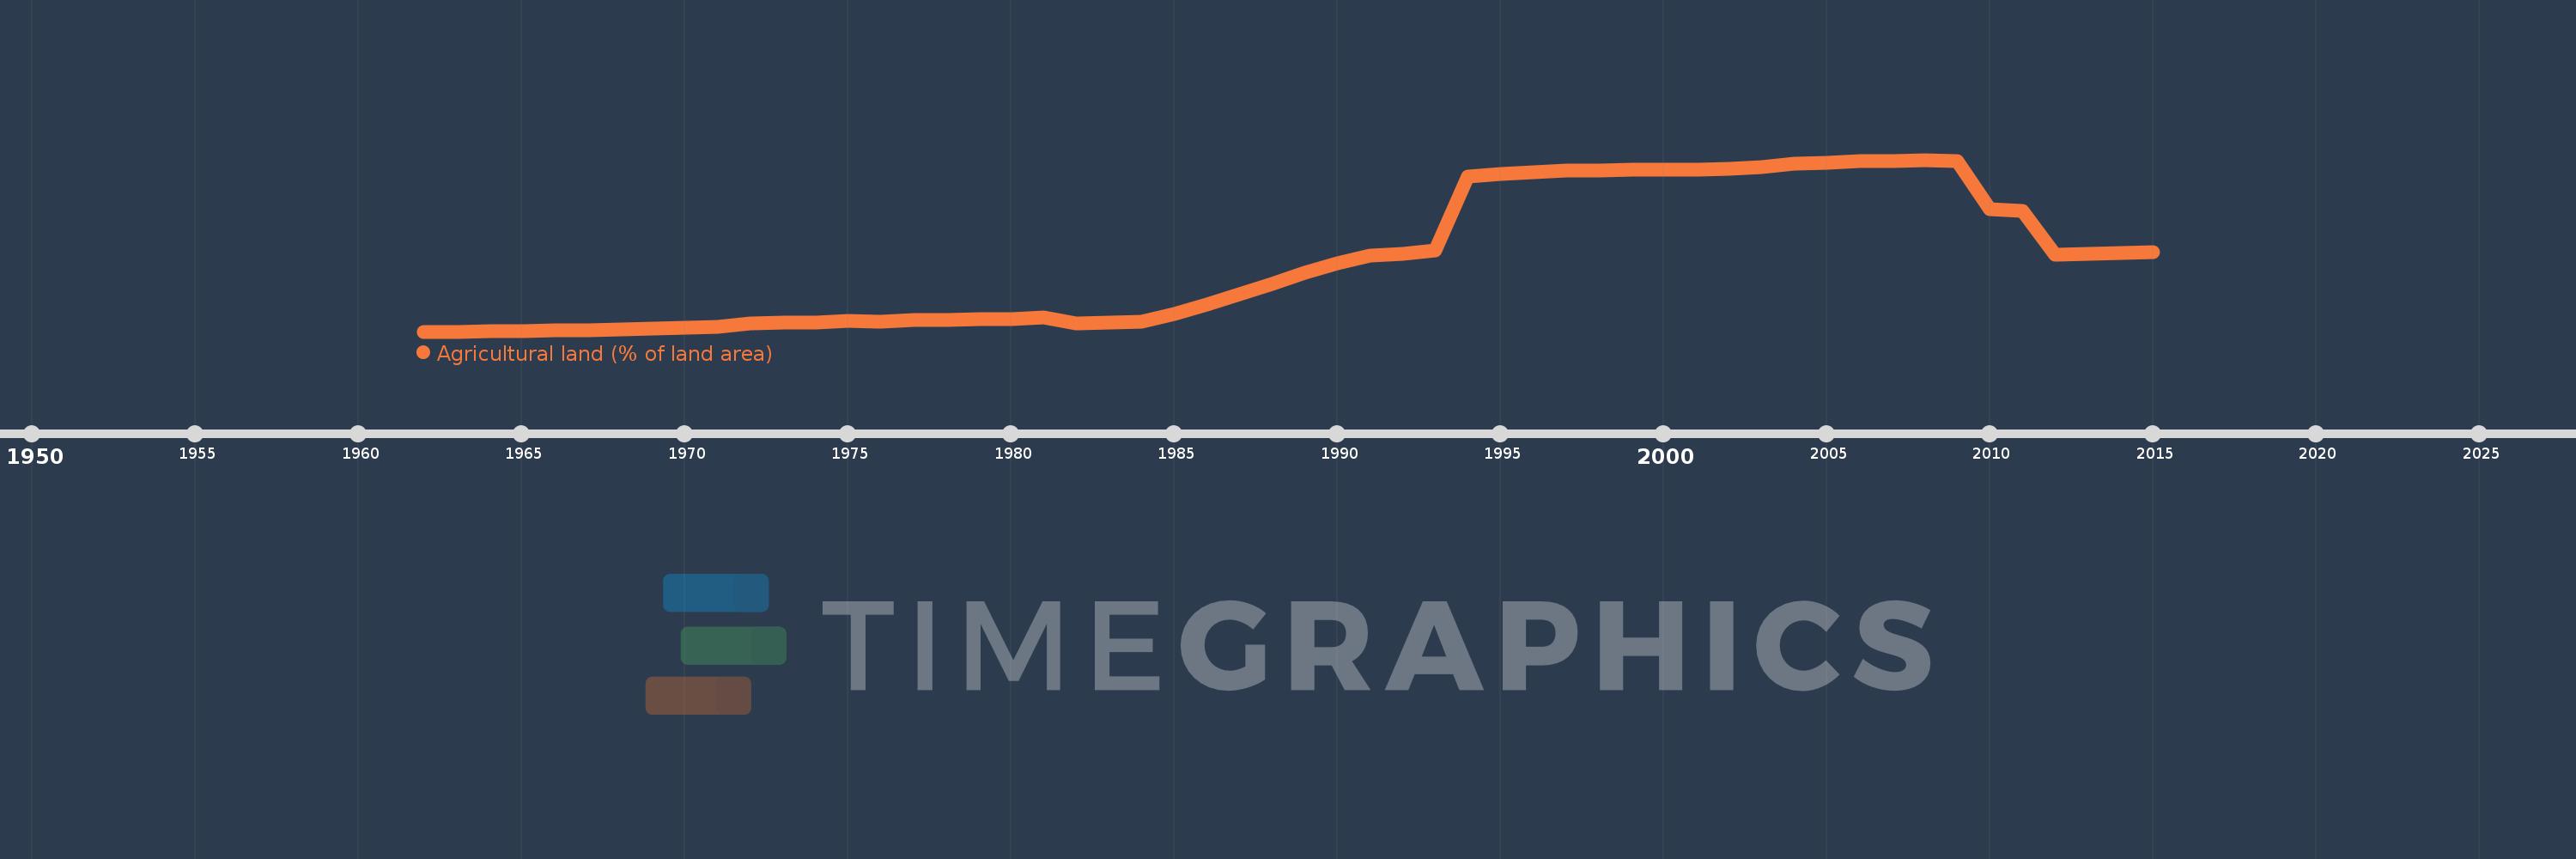
Agricultural land (% of land area)
2015,2014,2013,2012,2011,2010,2009,2008,2007,2006,2005,2004,2003,2002,2001,2000,1999,1998,1997,1996,1995,1994,1993,1992,1991,1990,1989,1988,1987,1986,1985,1984,1983,1982,1981,1980,1979,1978,1977,1976,1975,1974,1973,1972,1971,1970,1969,1968,1967,1966,1965,1964,1963,1962
Estas estadísticas en otros países:
AfghanistanAlbaniaAlgeriaAmerican SamoaAndorraAngolaAntigua and BarbudaArab WorldArgentinaArmeniaArubaAustraliaAustriaAzerbaijanBahamas, TheBahrainBangladeshBarbadosBelarusBelgiumBelizeBeninBermudaBhutanBoliviaBosnia and HerzegovinaBotswanaBrazilBritish Virgin IslandsBrunei DarussalamBulgariaBurkina FasoBurundiCabo VerdeCambodiaCameroonCanadaCaribbean small statesCayman IslandsCentral African RepublicCentral Europe and the BalticsChadChannel IslandsChileChinaColombiaComorosCongo, Dem. Rep.Congo, Rep.Costa RicaCote d'IvoireCroatiaCubaCyprusCzech RepublicDenmarkDjiboutiDominicaDominican RepublicEarly-demographic dividendEast Asia & PacificEast Asia & Pacific (excluding high income)East Asia & Pacific (IDA & IBRD countries)EcuadorEgypt, Arab Rep.El SalvadorEquatorial GuineaEritreaEstoniaEthiopiaEuro areaEurope & Central AsiaEurope & Central Asia (excluding high income)Europe & Central Asia (IDA & IBRD countries)European UnionFaroe IslandsFijiFinlandFragile and conflict affected situationsFranceFrench PolynesiaGabonGambia, TheGeorgiaGermanyGhanaGreeceGreenlandGrenadaGuamGuatemalaGuineaGuinea-BissauGuyanaHaitiHeavily indebted poor countries (HIPC)High incomeHondurasHong Kong SAR, ChinaHungaryIBRD onlyIcelandIDA & IBRD totalIDA blendIDA onlyIDA totalIndiaIndonesiaIran, Islamic Rep.IraqIrelandIsle of ManIsraelItalyJamaicaJapanJordanKazakhstanKenyaKiribatiKorea, Dem. People’s Rep.Korea, Rep.KosovoKuwaitKyrgyz RepublicLao PDRLate-demographic dividendLatin America & Caribbean Latin America & Caribbean (excluding high income)Latin America & the Caribbean (IDA & IBRD countries)LatviaLeast developed countries: UN classificationLebanonLesothoLiberiaLibyaLiechtensteinLithuaniaLow & middle incomeLow incomeLower middle incomeLuxembourgMacedonia, FYRMadagascarMalawiMalaysiaMaldivesMaliMaltaMarshall IslandsMauritaniaMauritiusMexicoMicronesia, Fed. Sts.Middle East & North AfricaMiddle East & North Africa (excluding high income)Middle East & North Africa (IDA & IBRD countries)Middle incomeMoldovaMongoliaMontenegroMoroccoMozambiqueMyanmarNamibiaNauruNepalNetherlandsNew CaledoniaNew ZealandNicaraguaNigerNigeriaNorth AmericaNorthern Mariana IslandsNorwayOECD membersOmanOther small statesPacific island small statesPakistanPalauPanamaPapua New GuineaParaguayPeruPhilippinesPolandPortugalPost-demographic dividendPre-demographic dividendPuerto RicoQatarRomaniaRussian FederationRwandaSamoaSan MarinoSao Tome and PrincipeSaudi ArabiaSenegalSerbiaSeychellesSierra LeoneSingaporeSlovak RepublicSloveniaSmall statesSolomon IslandsSomaliaSouth AfricaSouth AsiaSouth Asia (IDA & IBRD)SpainSri LankaSt. Kitts and NevisSt. LuciaSt. Vincent and the GrenadinesSub-Saharan Africa Sub-Saharan Africa (excluding high income)Sub-Saharan Africa (IDA & IBRD countries)SudanSurinameSwazilandSwedenSwitzerlandSyrian Arab RepublicTajikistanTanzaniaThailandTimor-LesteTogoTongaTrinidad and TobagoTunisiaTurkeyTurkmenistanTurks and Caicos IslandsTuvaluUgandaUkraineUnited Arab EmiratesUnited KingdomUnited StatesUpper middle incomeUruguayUzbekistanVanuatuVenezuela, RBVietnamVirgin Islands (U.S.)West Bank and GazaWorldYemen, Rep.ZambiaZimbabwe línea de tiempo (timeline):
En esta escala de tiempo se presenta un gráfico de 1962 y 2015 de Arab World. Los datos de 1961 están ausentes. El número de observaciones reales por fecha: 54.
Fuente (nombre):
Indicadores del desarrollo mundial
Fuente (organización):
Food and Agriculture Organization, electronic files and web site.
Categorías:
Agriculture & Rural Development, Climate Change, Environment
Se ha actualizado:
23 abr 2017 año
Los indicadores de los cambios de valor en los últimos años
Mínimo:
30.944
1 ene 1963 año
Máximo:
40.124
1 ene 2008 año
A la fecha de observación
Valor
Cambio absoluto
El cambio con respecto al valor anterior
1 ene 1962 año
30.944
+30.944
0.0%
1 ene 1963 año
30.944
0.0
0.0%
1 ene 1964 año
30.967
+0.023
0.07%
1 ene 1965 año
30.977
+0.009
0.03%
1 ene 1966 año
31.0
+0.023
0.07%
1 ene 1967 año
31.006
+0.007
0.02%
1 ene 1968 año
31.057
+0.051
0.17%
1 ene 1969 año
31.086
+0.029
0.09%
1 ene 1970 año
31.142
+0.055
0.18%
1 ene 1971 año
31.204
+0.063
0.2%
1 ene 1972 año
31.399
+0.195
0.63%
1 ene 1973 año
31.447
+0.047
0.15%
1 ene 1974 año
31.442
-0.005
-0.01%
1 ene 1975 año
31.495
+0.053
0.17%
1 ene 1976 año
31.472
-0.022
-0.07%
1 ene 1977 año
31.541
+0.069
0.22%
1 ene 1978 año
31.562
+0.021
0.07%
1 ene 1979 año
31.604
+0.043
0.14%
1 ene 1980 año
31.615
+0.011
0.03%
1 ene 1981 año
31.694
+0.079
0.25%
1 ene 1982 año
31.389
-0.306
-0.96%
1 ene 1983 año
31.413
+0.024
0.08%
1 ene 1984 año
31.46
+0.047
0.15%
1 ene 1985 año
31.871
+0.412
1.31%
1 ene 1986 año
32.369
+0.498
1.56%
1 ene 1987 año
32.951
+0.582
1.8%
1 ene 1988 año
33.505
+0.554
1.68%
1 ene 1989 año
34.096
+0.591
1.76%
1 ene 1990 año
34.616
+0.52
1.52%
1 ene 1991 año
35.027
+0.411
1.19%
1 ene 1992 año
35.118
+0.09
0.26%
1 ene 1993 año
35.279
+0.161
0.46%
1 ene 1994 año
39.226
+3.947
11.19%
1 ene 1995 año
39.37
+0.144
0.37%
1 ene 1996 año
39.471
+0.101
0.26%
1 ene 1997 año
39.553
+0.082
0.21%
1 ene 1998 año
39.55
-0.003
-0.01%
1 ene 1999 año
39.587
+0.037
0.09%
1 ene 2000 año
39.601
+0.014
0.04%
1 ene 2001 año
39.602
+0.001
0.0%
1 ene 2002 año
39.637
+0.035
0.09%
1 ene 2003 año
39.727
+0.09
0.23%
1 ene 2004 año
39.907
+0.18
0.45%
1 ene 2005 año
39.96
+0.053
0.13%
1 ene 2006 año
40.059
+0.099
0.25%
1 ene 2007 año
40.078
+0.019
0.05%
1 ene 2008 año
40.124
+0.045
0.11%
1 ene 2009 año
40.063
-0.06
-0.15%
1 ene 2010 año
37.507
-2.556
-6.38%
1 ene 2011 año
37.383
-0.124
-0.33%
1 ene 2012 año
35.06
-2.324
-6.22%
1 ene 2013 año
35.088
+0.028
0.08%
1 ene 2014 año
35.166
+0.078
0.22%
1 ene 2015 año
35.204
+0.038
0.11%
Ranking de los países por los datos estadísticos actuales


Comentarios: