29
/es/
es
AIzaSyAYiBZKx7MnpbEhh9jyipgxe19OcubqV5w
April 1, 2024
89580
Botswana
BWA
true
2
1
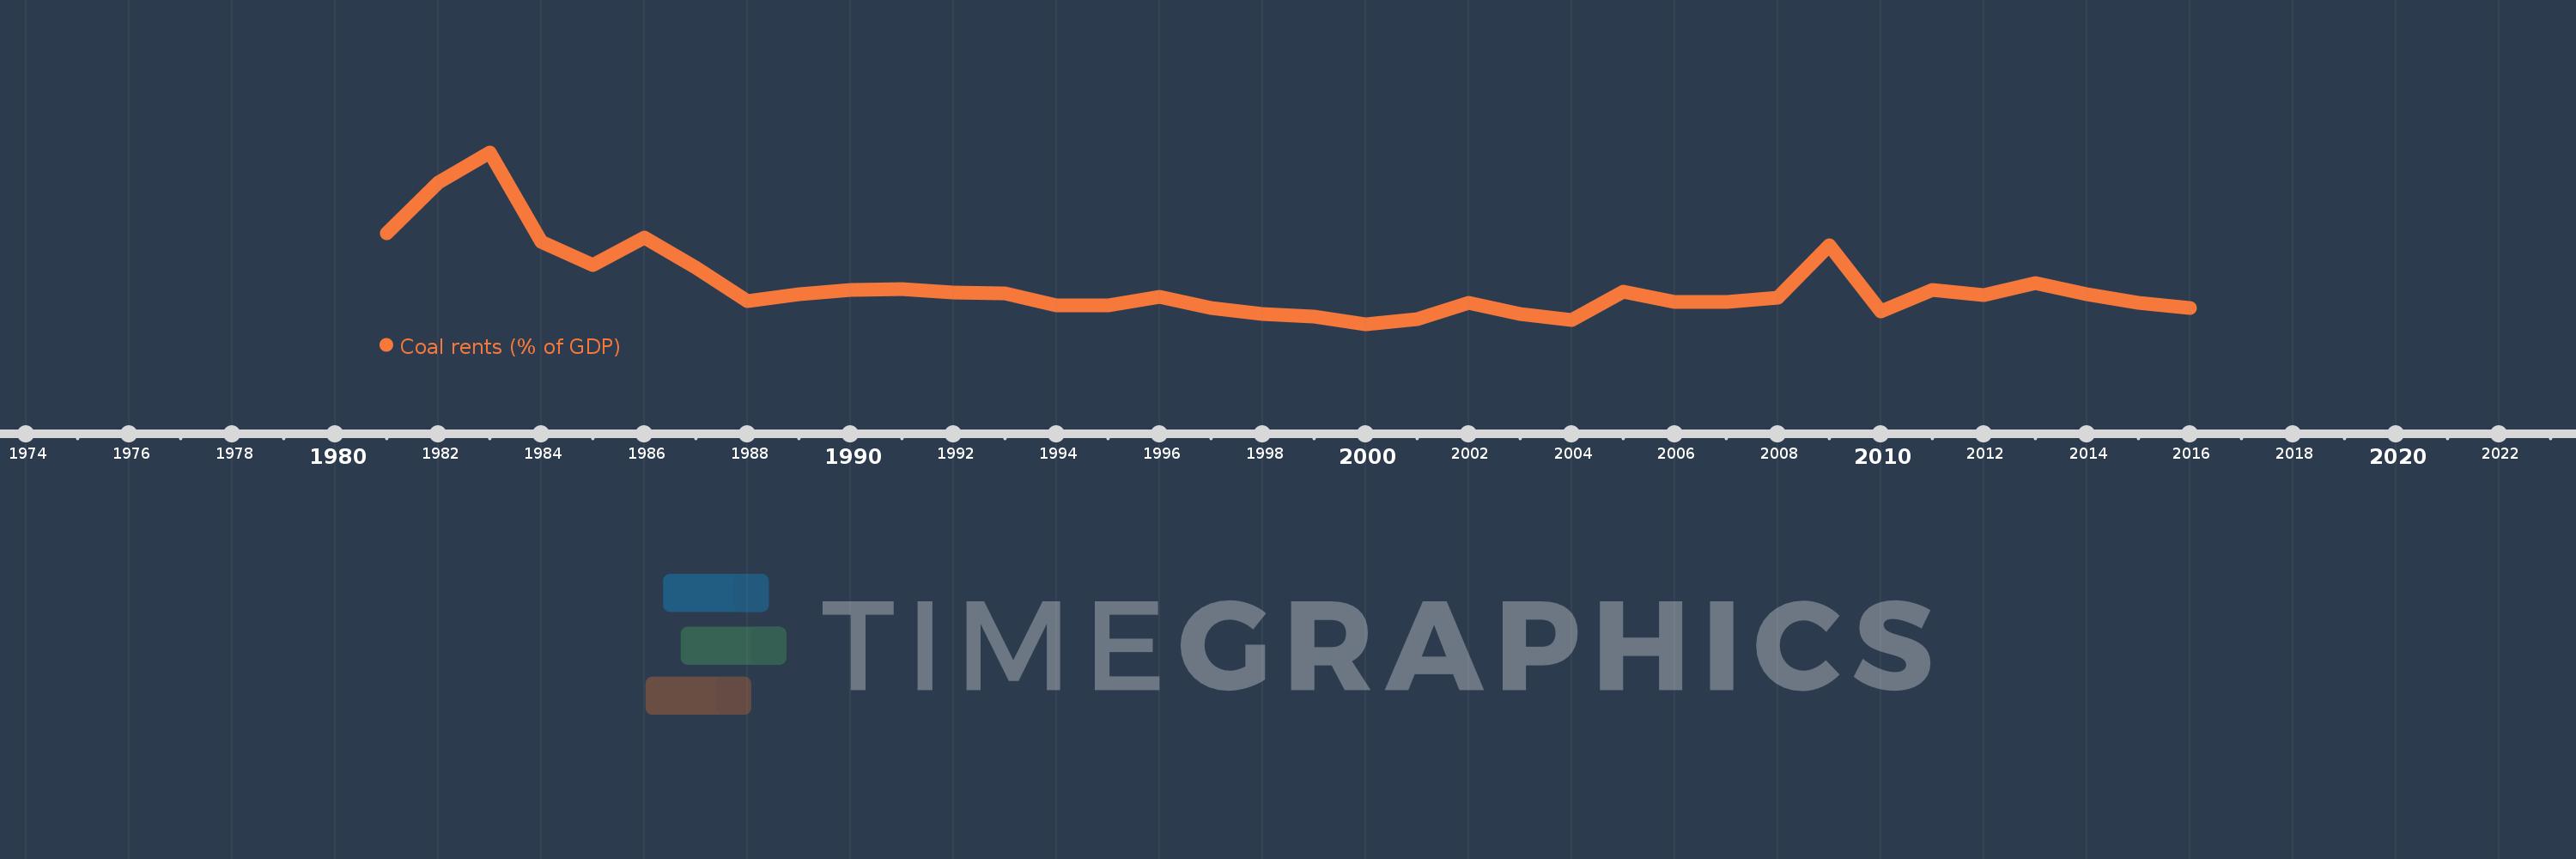
Coal rents (% of GDP)
2016,2015,2014,2013,2012,2011,2010,2009,2008,2007,2006,2005,2004,2003,2002,2001,2000,1999,1998,1997,1996,1995,1994,1993,1992,1991,1990,1989,1988,1987,1986,1985,1984,1983,1982,1981
Estas estadísticas en otros países:
AfghanistanAlbaniaAlgeriaAngolaAntigua and BarbudaArab WorldArgentinaArmeniaArubaAustraliaAustriaAzerbaijanBahamas, TheBahrainBangladeshBarbadosBelarusBelgiumBelizeBeninBermudaBhutanBoliviaBosnia and HerzegovinaBotswanaBrazilBrunei DarussalamBulgariaBurkina FasoBurundiCabo VerdeCambodiaCameroonCanadaCaribbean small statesCayman IslandsCentral African RepublicCentral Europe and the BalticsChadChileChinaColombiaComorosCongo, Dem. Rep.Congo, Rep.Costa RicaCote d'IvoireCroatiaCubaCyprusCzech RepublicDenmarkDjiboutiDominicaDominican RepublicEarly-demographic dividendEast Asia & PacificEast Asia & Pacific (excluding high income)East Asia & Pacific (IDA & IBRD countries)EcuadorEgypt, Arab Rep.El SalvadorEquatorial GuineaEritreaEstoniaEthiopiaEuro areaEurope & Central AsiaEurope & Central Asia (excluding high income)Europe & Central Asia (IDA & IBRD countries)European UnionFijiFinlandFragile and conflict affected situationsFranceFrench PolynesiaGabonGambia, TheGeorgiaGermanyGhanaGreeceGreenlandGrenadaGuatemalaGuineaGuinea-BissauGuyanaHaitiHeavily indebted poor countries (HIPC)High incomeHondurasHong Kong SAR, ChinaHungaryIBRD onlyIcelandIDA & IBRD totalIDA blendIDA onlyIDA totalIndiaIndonesiaIran, Islamic Rep.IraqIrelandIsraelItalyJamaicaJapanJordanKazakhstanKenyaKiribatiKorea, Rep.KosovoKuwaitKyrgyz RepublicLao PDRLate-demographic dividendLatin America & Caribbean Latin America & Caribbean (excluding high income)Latin America & the Caribbean (IDA & IBRD countries)LatviaLeast developed countries: UN classificationLebanonLesothoLiberiaLibyaLithuaniaLow & middle incomeLow incomeLower middle incomeLuxembourgMacao SAR, ChinaMacedonia, FYRMadagascarMalawiMalaysiaMaldivesMaliMaltaMauritaniaMauritiusMexicoMiddle East & North AfricaMiddle East & North Africa (excluding high income)Middle East & North Africa (IDA & IBRD countries)Middle incomeMoldovaMongoliaMontenegroMoroccoMozambiqueMyanmarNamibiaNepalNetherlandsNew CaledoniaNew ZealandNicaraguaNigerNigeriaNorth AmericaNorwayOECD membersOmanOther small statesPacific island small statesPakistanPanamaPapua New GuineaParaguayPeruPhilippinesPolandPortugalPost-demographic dividendPre-demographic dividendPuerto RicoQatarRomaniaRussian FederationRwandaSamoaSao Tome and PrincipeSaudi ArabiaSenegalSerbiaSeychellesSierra LeoneSingaporeSlovak RepublicSloveniaSmall statesSolomon IslandsSouth AfricaSouth AsiaSouth Asia (IDA & IBRD)SpainSri LankaSt. Kitts and NevisSt. LuciaSt. Vincent and the GrenadinesSub-Saharan Africa Sub-Saharan Africa (excluding high income)Sub-Saharan Africa (IDA & IBRD countries)SudanSurinameSwazilandSwedenSwitzerlandSyrian Arab RepublicTajikistanTanzaniaThailandTimor-LesteTogoTongaTrinidad and TobagoTunisiaTurkeyTurkmenistanUgandaUkraineUnited Arab EmiratesUnited KingdomUnited StatesUpper middle incomeUruguayUzbekistanVanuatuVenezuela, RBVietnamVirgin Islands (U.S.)West Bank and GazaWorldYemen, Rep.ZambiaZimbabwe línea de tiempo (timeline):
En esta escala de tiempo se presenta un gráfico de 1981 y 2016 de Botswana. Los datos de 1980 están ausentes. El número de observaciones reales por fecha: 36.
Fuente (nombre):
Indicadores del desarrollo mundial
Fuente (organización):
Estimates based on sources and methods described in "The Changing Wealth of Nations: Measuring Sustainable Development in the New Millennium" (World Bank, 2011).
Categorías:
Environment
Se ha actualizado:
23 abr 2017 año
Los indicadores de los cambios de valor en los últimos años
Mínimo:
0.097
1 ene 2000 año
Máximo:
1.489
1 ene 1983 año
A la fecha de observación
Valor
Cambio absoluto
El cambio con respecto al valor anterior
1 ene 1981 año
0.833
+0.833
0.0%
1 ene 1982 año
1.246
+0.414
49.66%
1 ene 1983 año
1.489
+0.242
19.43%
1 ene 1984 año
0.763
-0.725
-48.72%
1 ene 1985 año
0.575
-0.188
-24.64%
1 ene 1986 año
0.797
+0.222
38.64%
1 ene 1987 año
0.557
-0.24
-30.16%
1 ene 1988 año
0.286
-0.27
-48.56%
1 ene 1989 año
0.337
+0.05
17.55%
1 ene 1990 año
0.372
+0.035
10.42%
1 ene 1991 año
0.384
+0.013
3.4%
1 ene 1992 año
0.355
-0.029
-7.6%
1 ene 1993 año
0.347
-0.008
-2.26%
1 ene 1994 año
0.249
-0.098
-28.22%
1 ene 1995 año
0.25
+0.001
0.44%
1 ene 1996 año
0.322
+0.072
28.73%
1 ene 1997 año
0.231
-0.091
-28.19%
1 ene 1998 año
0.183
-0.049
-21.02%
1 ene 1999 año
0.16
-0.022
-12.24%
1 ene 2000 año
0.097
-0.063
-39.38%
1 ene 2001 año
0.139
+0.042
43.01%
1 ene 2002 año
0.268
+0.129
92.51%
1 ene 2003 año
0.177
-0.091
-34.05%
1 ene 2004 año
0.134
-0.042
-23.88%
1 ene 2005 año
0.361
+0.226
168.34%
1 ene 2006 año
0.278
-0.083
-23.02%
1 ene 2007 año
0.28
+0.003
1.04%
1 ene 2008 año
0.309
+0.029
10.26%
1 ene 2009 año
0.737
+0.427
138.22%
1 ene 2010 año
0.202
-0.535
-72.56%
1 ene 2011 año
0.375
+0.173
85.65%
1 ene 2012 año
0.331
-0.044
-11.7%
1 ene 2013 año
0.429
+0.097
29.39%
1 ene 2014 año
0.34
-0.088
-20.61%
1 ene 2015 año
0.269
-0.071
-20.82%
1 ene 2016 año
0.232
-0.037
-13.9%
Ranking de los países por los datos estadísticos actuales


Comentarios: