30
/es/
AIzaSyAYiBZKx7MnpbEhh9jyipgxe19OcubqV5w
April 1, 2024
173897
Lao PDR
LAO
true
2
1
Coal rents (% of GDP)
2013,2012,2011,2010,2009,2008,2007,2006,2005,2004,2003,2002,2001,2000,1999,1998,1997,1996,1995,1994,1993,1992,1991,1990,1989,1988,1987,1986,1985
Download
Estadísticas Globales de la Biblioteca →Lao PDR →

Coal rents (% of GDP)

Estas estadísticas en otros países:

AfghanistanAlbaniaAlgeriaAngolaAntigua and BarbudaArab WorldArgentinaArmeniaArubaAustraliaAustriaAzerbaijanBahamas, TheBahrainBangladeshBarbadosBelarusBelgiumBelizeBeninBermudaBhutanBoliviaBosnia and HerzegovinaBotswanaBrazilBrunei DarussalamBulgariaBurkina FasoBurundiCabo VerdeCambodiaCameroonCanadaCaribbean small statesCayman IslandsCentral African RepublicCentral Europe and the BalticsChadChileChinaColombiaComorosCongo, Dem. Rep.Congo, Rep.Costa RicaCote d'IvoireCroatiaCubaCyprusCzech RepublicDenmarkDjiboutiDominicaDominican RepublicEarly-demographic dividendEast Asia & PacificEast Asia & Pacific (excluding high income)East Asia & Pacific (IDA & IBRD countries)EcuadorEgypt, Arab Rep.El SalvadorEquatorial GuineaEritreaEstoniaEthiopiaEuro areaEurope & Central AsiaEurope & Central Asia (excluding high income)Europe & Central Asia (IDA & IBRD countries)European UnionFijiFinlandFragile and conflict affected situationsFranceFrench PolynesiaGabonGambia, TheGeorgiaGermanyGhanaGreeceGreenlandGrenadaGuatemalaGuineaGuinea-BissauGuyanaHaitiHeavily indebted poor countries (HIPC)High incomeHondurasHong Kong SAR, ChinaHungaryIBRD onlyIcelandIDA & IBRD totalIDA blendIDA onlyIDA totalIndiaIndonesiaIran, Islamic Rep.IraqIrelandIsraelItalyJamaicaJapanJordanKazakhstanKenyaKiribatiKorea, Rep.KosovoKuwaitKyrgyz RepublicLao PDRLate-demographic dividendLatin America & Caribbean Latin America & Caribbean (excluding high income)Latin America & the Caribbean (IDA & IBRD countries)LatviaLeast developed countries: UN classificationLebanonLesothoLiberiaLibyaLithuaniaLow & middle incomeLow incomeLower middle incomeLuxembourgMacao SAR, ChinaMacedonia, FYRMadagascarMalawiMalaysiaMaldivesMaliMaltaMauritaniaMauritiusMexicoMiddle East & North AfricaMiddle East & North Africa (excluding high income)Middle East & North Africa (IDA & IBRD countries)Middle incomeMoldovaMongoliaMontenegroMoroccoMozambiqueMyanmarNamibiaNepalNetherlandsNew CaledoniaNew ZealandNicaraguaNigerNigeriaNorth AmericaNorwayOECD membersOmanOther small statesPacific island small statesPakistanPanamaPapua New GuineaParaguayPeruPhilippinesPolandPortugalPost-demographic dividendPre-demographic dividendPuerto RicoQatarRomaniaRussian FederationRwandaSamoaSao Tome and PrincipeSaudi ArabiaSenegalSerbiaSeychellesSierra LeoneSingaporeSlovak RepublicSloveniaSmall statesSolomon IslandsSouth AfricaSouth AsiaSouth Asia (IDA & IBRD)SpainSri LankaSt. Kitts and NevisSt. LuciaSt. Vincent and the GrenadinesSub-Saharan Africa Sub-Saharan Africa (excluding high income)Sub-Saharan Africa (IDA & IBRD countries)SudanSurinameSwazilandSwedenSwitzerlandSyrian Arab RepublicTajikistanTanzaniaThailandTimor-LesteTogoTongaTrinidad and TobagoTunisiaTurkeyTurkmenistanUgandaUkraineUnited Arab EmiratesUnited KingdomUnited StatesUpper middle incomeUruguayUzbekistanVanuatuVenezuela, RBVietnamVirgin Islands (U.S.)West Bank and GazaWorldYemen, Rep.ZambiaZimbabwe

línea de tiempo (timeline):

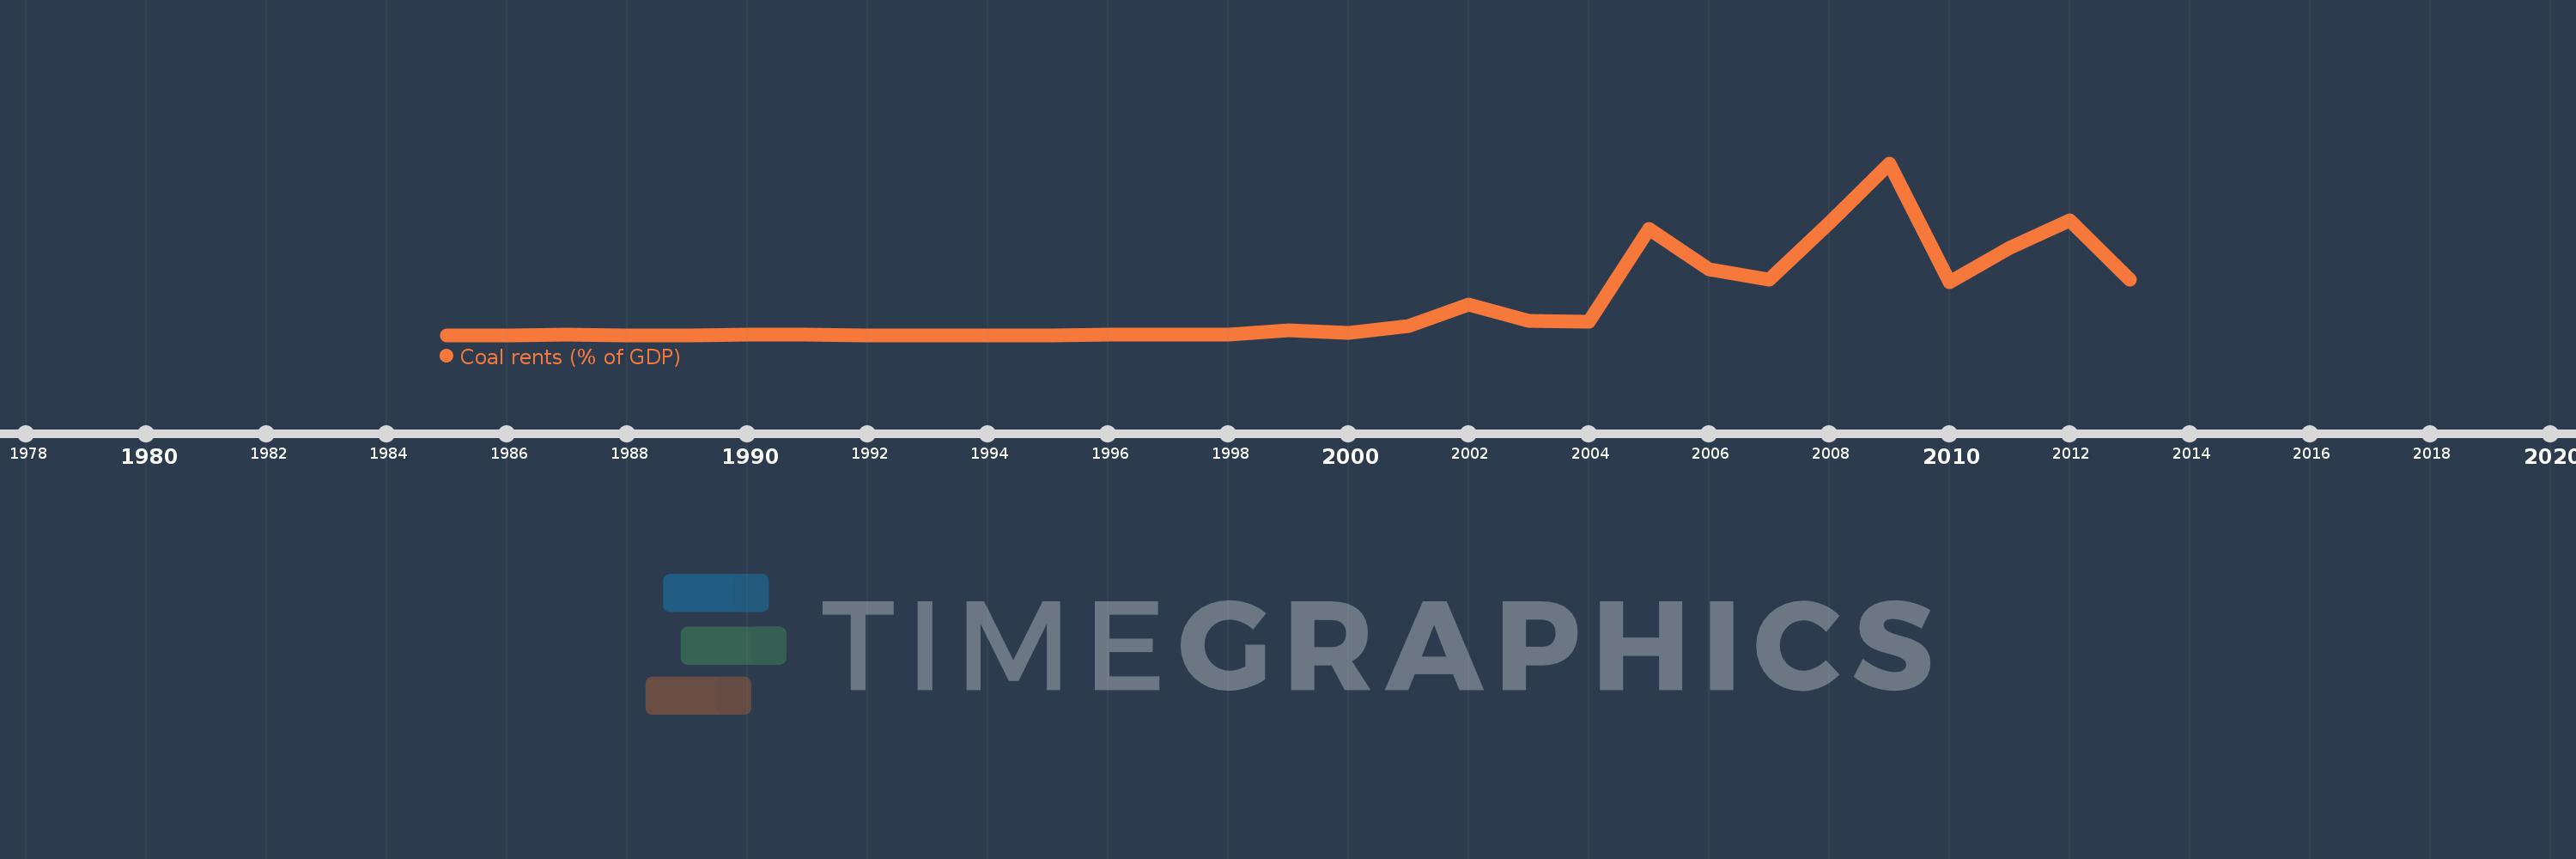
En esta escala de tiempo se presenta un gráfico de 1985 y 2013 de Lao PDR. Los datos de 1984 están ausentes. El número de observaciones reales por fecha: 29.

Fuente (nombre):

Indicadores del desarrollo mundial

Fuente (organización):

Estimates based on sources and methods described in "The Changing Wealth of Nations: Measuring Sustainable Development in the New Millennium" (World Bank, 2011).

Categorías:

Environment

Se ha actualizado:

23 abr 2017 año

Los indicadores de los cambios de valor en los últimos años

En promedio:
0.159
Mínimo:
0.0
1 ene 1995 año
Máximo:
0.884
1 ene 2009 año
A la fecha de observación
Valor
Cambio absoluto
El cambio con respecto al valor anterior
1 ene 1985 año
0.0
+0.0
0.0%
1 ene 1986 año
0.0
+0.0
134.44%
1 ene 1987 año
0.001
+0.0
22.85%
1 ene 1988 año
0.0
-0.001
-97.49%
1 ene 1989 año
0.0
+0.0
3.2 mil%
1 ene 1990 año
0.001
+0.0
43.64%
1 ene 1991 año
0.001
0.0
-4.8%
1 ene 1992 año
0.0
0.0
-32.62%
1 ene 1993 año
0.0
0.0
-56.15%
1 ene 1994 año
0.0
0.0
-94.59%
1 ene 1995 año
0.0
0.0
-15.32%
1 ene 1996 año
0.002
+0.002
18.05 mil%
1 ene 1997 año
0.001
-0.001
-55.78%
1 ene 1998 año
0.001
+0.0
27.68%
1 ene 1999 año
0.024
+0.023
2.63 mil%
1 ene 2000 año
0.012
-0.012
-48.9%
1 ene 2001 año
0.048
+0.036
287.7%
1 ene 2002 año
0.157
+0.109
226.54%
1 ene 2003 año
0.073
-0.084
-53.43%
1 ene 2004 año
0.067
-0.006
-7.84%
1 ene 2005 año
0.544
+0.477
708.08%
1 ene 2006 año
0.336
-0.209
-38.33%
1 ene 2007 año
0.285
-0.05
-15.04%
1 ene 2008 año
0.577
+0.292
102.45%
1 ene 2009 año
0.884
+0.307
53.17%
1 ene 2010 año
0.273
-0.611
-69.17%
1 ene 2011 año
0.448
+0.175
64.34%
1 ene 2012 año
0.592
+0.144
32.22%
1 ene 2013 año
0.285
-0.307
-51.9%

Ranking de los países por los datos estadísticos actuales