29
/es/
es
AIzaSyAYiBZKx7MnpbEhh9jyipgxe19OcubqV5w
April 1, 2024
85938
Bhutan
BTN
true
2
1
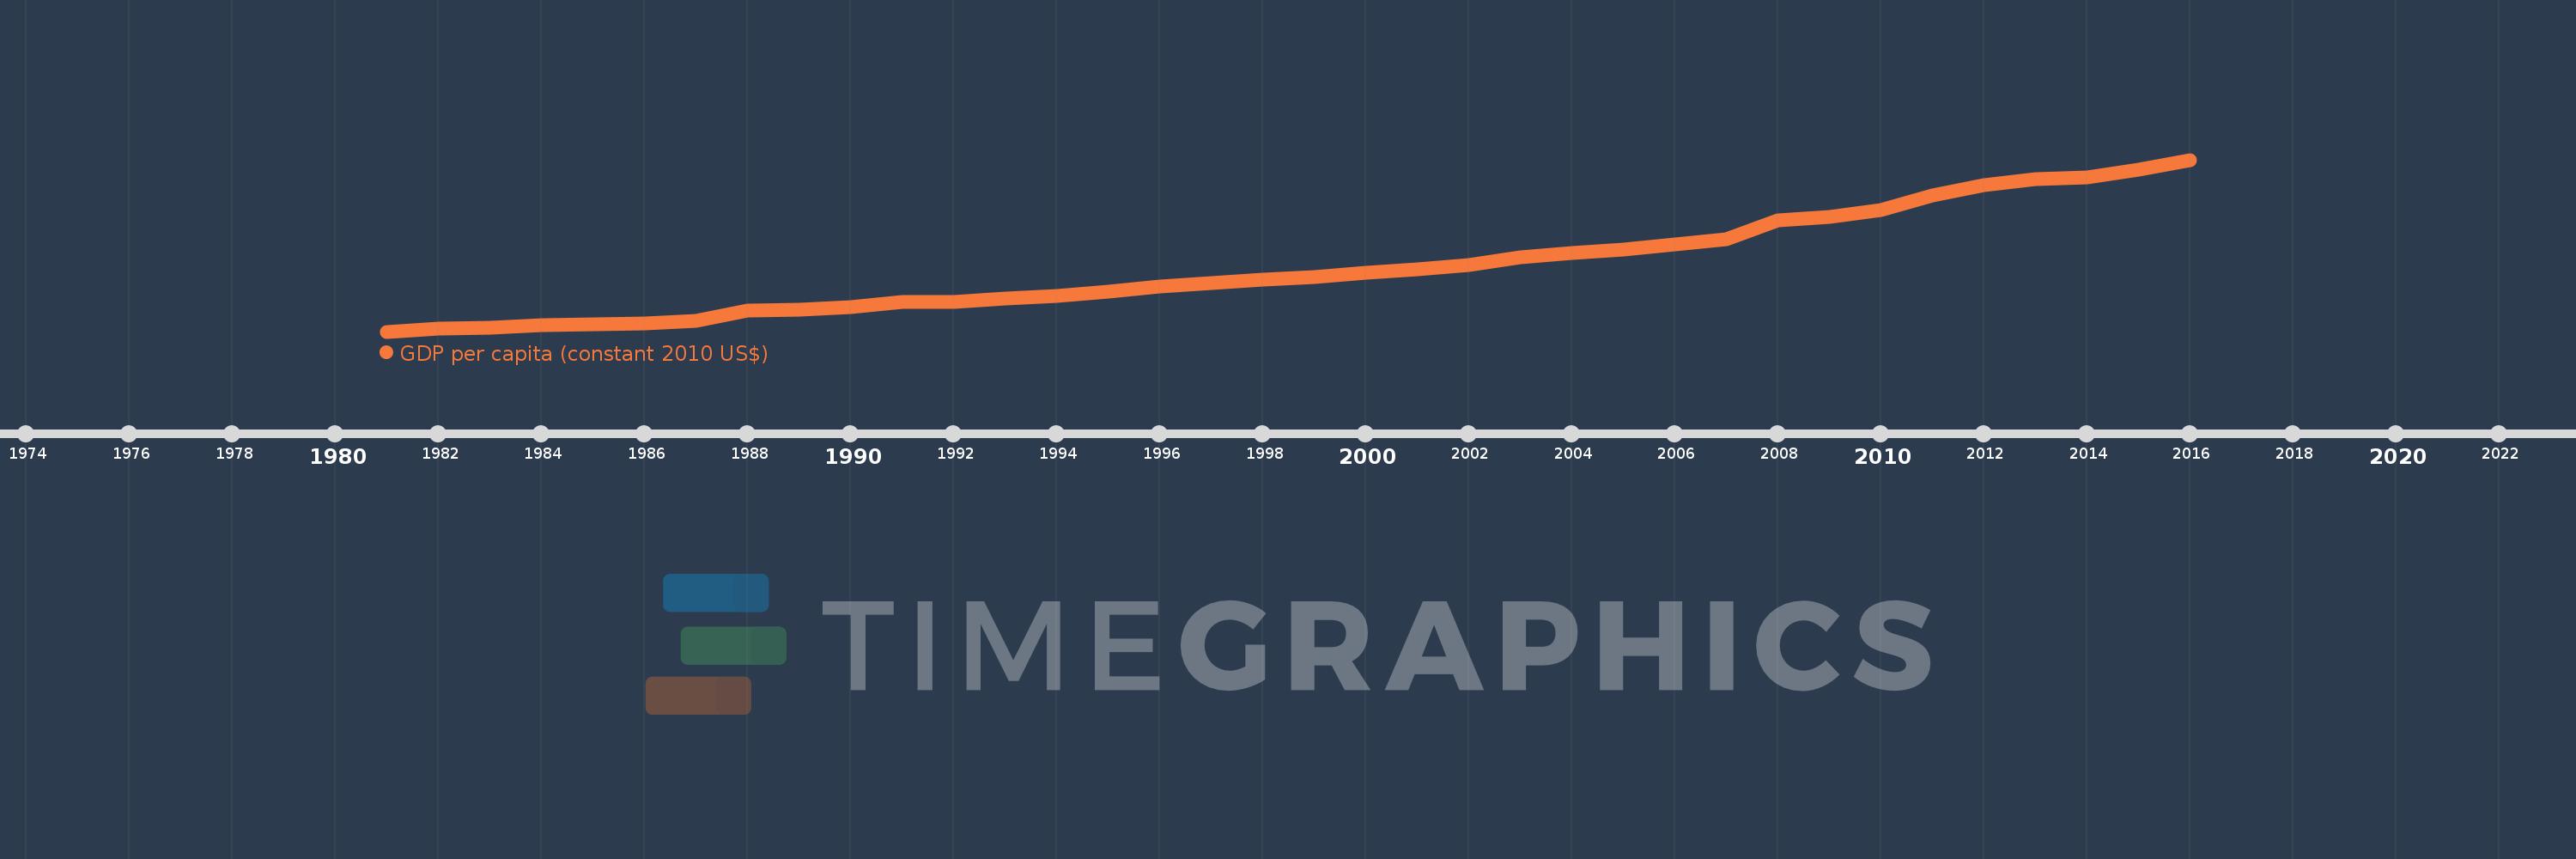
GDP per capita (constant 2010 US$)
2016,2015,2014,2013,2012,2011,2010,2009,2008,2007,2006,2005,2004,2003,2002,2001,2000,1999,1998,1997,1996,1995,1994,1993,1992,1991,1990,1989,1988,1987,1986,1985,1984,1983,1982,1981
Estas estadísticas en otros países:
AfghanistanAlbaniaAlgeriaAndorraAngolaAntigua and BarbudaArab WorldArgentinaArmeniaArubaAustraliaAustriaAzerbaijanBahamas, TheBahrainBangladeshBarbadosBelarusBelgiumBelizeBeninBermudaBhutanBoliviaBosnia and HerzegovinaBotswanaBrazilBrunei DarussalamBulgariaBurkina FasoBurundiCabo VerdeCambodiaCameroonCanadaCaribbean small statesCentral African RepublicCentral Europe and the BalticsChadChileChinaColombiaComorosCongo, Dem. Rep.Congo, Rep.Costa RicaCote d'IvoireCroatiaCubaCyprusCzech RepublicDenmarkDjiboutiDominicaDominican RepublicEarly-demographic dividendEast Asia & PacificEast Asia & Pacific (excluding high income)East Asia & Pacific (IDA & IBRD countries)EcuadorEgypt, Arab Rep.El SalvadorEquatorial GuineaEritreaEstoniaEthiopiaEuro areaEurope & Central AsiaEurope & Central Asia (excluding high income)Europe & Central Asia (IDA & IBRD countries)European UnionFaroe IslandsFijiFinlandFragile and conflict affected situationsFranceGabonGambia, TheGeorgiaGermanyGhanaGreeceGreenlandGrenadaGuatemalaGuineaGuinea-BissauGuyanaHaitiHeavily indebted poor countries (HIPC)High incomeHondurasHong Kong SAR, ChinaHungaryIBRD onlyIcelandIDA & IBRD totalIDA blendIDA onlyIDA totalIndiaIndonesiaIran, Islamic Rep.IraqIrelandIsle of ManIsraelItalyJamaicaJapanJordanKazakhstanKenyaKiribatiKorea, Rep.KosovoKuwaitKyrgyz RepublicLao PDRLate-demographic dividendLatin America & Caribbean Latin America & Caribbean (excluding high income)Latin America & the Caribbean (IDA & IBRD countries)LatviaLeast developed countries: UN classificationLebanonLesothoLiberiaLibyaLiechtensteinLithuaniaLow & middle incomeLow incomeLower middle incomeLuxembourgMacao SAR, ChinaMacedonia, FYRMadagascarMalawiMalaysiaMaldivesMaliMaltaMarshall IslandsMauritaniaMauritiusMexicoMicronesia, Fed. Sts.Middle East & North AfricaMiddle East & North Africa (excluding high income)Middle East & North Africa (IDA & IBRD countries)Middle incomeMoldovaMonacoMongoliaMontenegroMoroccoMozambiqueMyanmarNamibiaNauruNepalNetherlandsNew ZealandNicaraguaNigerNigeriaNorth AmericaNorwayOECD membersOmanOther small statesPacific island small statesPakistanPalauPanamaPapua New GuineaParaguayPeruPhilippinesPolandPortugalPost-demographic dividendPre-demographic dividendPuerto RicoQatarRomaniaRussian FederationRwandaSamoaSao Tome and PrincipeSaudi ArabiaSenegalSerbiaSeychellesSierra LeoneSingaporeSlovak RepublicSloveniaSmall statesSolomon IslandsSouth AfricaSouth AsiaSouth Asia (IDA & IBRD)South SudanSpainSri LankaSt. Kitts and NevisSt. LuciaSt. Vincent and the GrenadinesSub-Saharan Africa Sub-Saharan Africa (excluding high income)Sub-Saharan Africa (IDA & IBRD countries)SudanSurinameSwazilandSwedenSwitzerlandTajikistanTanzaniaThailandTimor-LesteTogoTongaTrinidad and TobagoTunisiaTurkeyTurkmenistanTuvaluUgandaUkraineUnited Arab EmiratesUnited KingdomUnited StatesUpper middle incomeUruguayUzbekistanVanuatuVenezuela, RBVietnamWest Bank and GazaWorldYemen, Rep.ZambiaZimbabwe línea de tiempo (timeline):
En esta escala de tiempo se presenta un gráfico de 1981 y 2016 de Bhutan. Los datos de 1980 están ausentes. El número de observaciones reales por fecha: 36.
Fuente (nombre):
Indicadores del desarrollo mundial
Fuente (organización):
World Bank national accounts data, and OECD National Accounts data files.
Categorías:
Economy & Growth
Se ha actualizado:
23 abr 2017 año
Los indicadores de los cambios de valor en los últimos años
Mínimo:
400.342
1 ene 1981 año
Máximo:
2.668 mil
1 ene 2016 año
A la fecha de observación
Valor
Cambio absoluto
El cambio con respecto al valor anterior
1 ene 1981 año
400.342
+400.342
0.0%
1 ene 1982 año
443.836
+43.494
10.86%
1 ene 1983 año
447.895
+4.06
0.91%
1 ene 1984 año
486.894
+38.999
8.71%
1 ene 1985 año
496.063
+9.169
1.88%
1 ene 1986 año
502.765
+6.702
1.35%
1 ene 1987 año
544.175
+41.41
8.24%
1 ene 1988 año
676.845
+132.67
24.38%
1 ene 1989 año
688.453
+11.608
1.72%
1 ene 1990 año
722.552
+34.099
4.95%
1 ene 1991 año
791.833
+69.281
9.59%
1 ene 1992 año
789.823
-2.01
-0.25%
1 ene 1993 año
836.477
+46.653
5.91%
1 ene 1994 año
868.281
+31.805
3.8%
1 ene 1995 año
924.577
+56.295
6.48%
1 ene 1996 año
994.817
+70.24
7.6%
1 ene 1997 año
1.043 mil
+48.231
4.85%
1 ene 1998 año
1.081 mil
+38.033
3.65%
1 ene 1999 año
1.118 mil
+36.917
3.41%
1 ene 2000 año
1.174 mil
+56.5
5.05%
1 ene 2001 año
1.221 mil
+46.256
3.94%
1 ene 2002 año
1.283 mil
+62.401
5.11%
1 ene 2003 año
1.379 mil
+95.78
7.46%
1 ene 2004 año
1.441 mil
+62.21
4.51%
1 ene 2005 año
1.483 mil
+42.239
2.93%
1 ene 2006 año
1.548 mil
+64.345
4.34%
1 ene 2007 año
1.615 mil
+66.937
4.32%
1 ene 2008 año
1.863 mil
+248.785
15.41%
1 ene 2009 año
1.914 mil
+50.879
2.73%
1 ene 2010 año
2.005 mil
+90.404
4.72%
1 ene 2011 año
2.201 mil
+196.56
9.8%
1 ene 2012 año
2.336 mil
+134.781
6.12%
1 ene 2013 año
2.417 mil
+80.64
3.45%
1 ene 2014 año
2.433 mil
+16.038
0.66%
1 ene 2015 año
2.538 mil
+104.898
4.31%
1 ene 2016 año
2.668 mil
+130.472
5.14%
Ranking de los países por los datos estadísticos actuales


Comentarios: