29
/es/
es
AIzaSyAYiBZKx7MnpbEhh9jyipgxe19OcubqV5w
April 1, 2024
204129
Myanmar
MMR
true
2
1
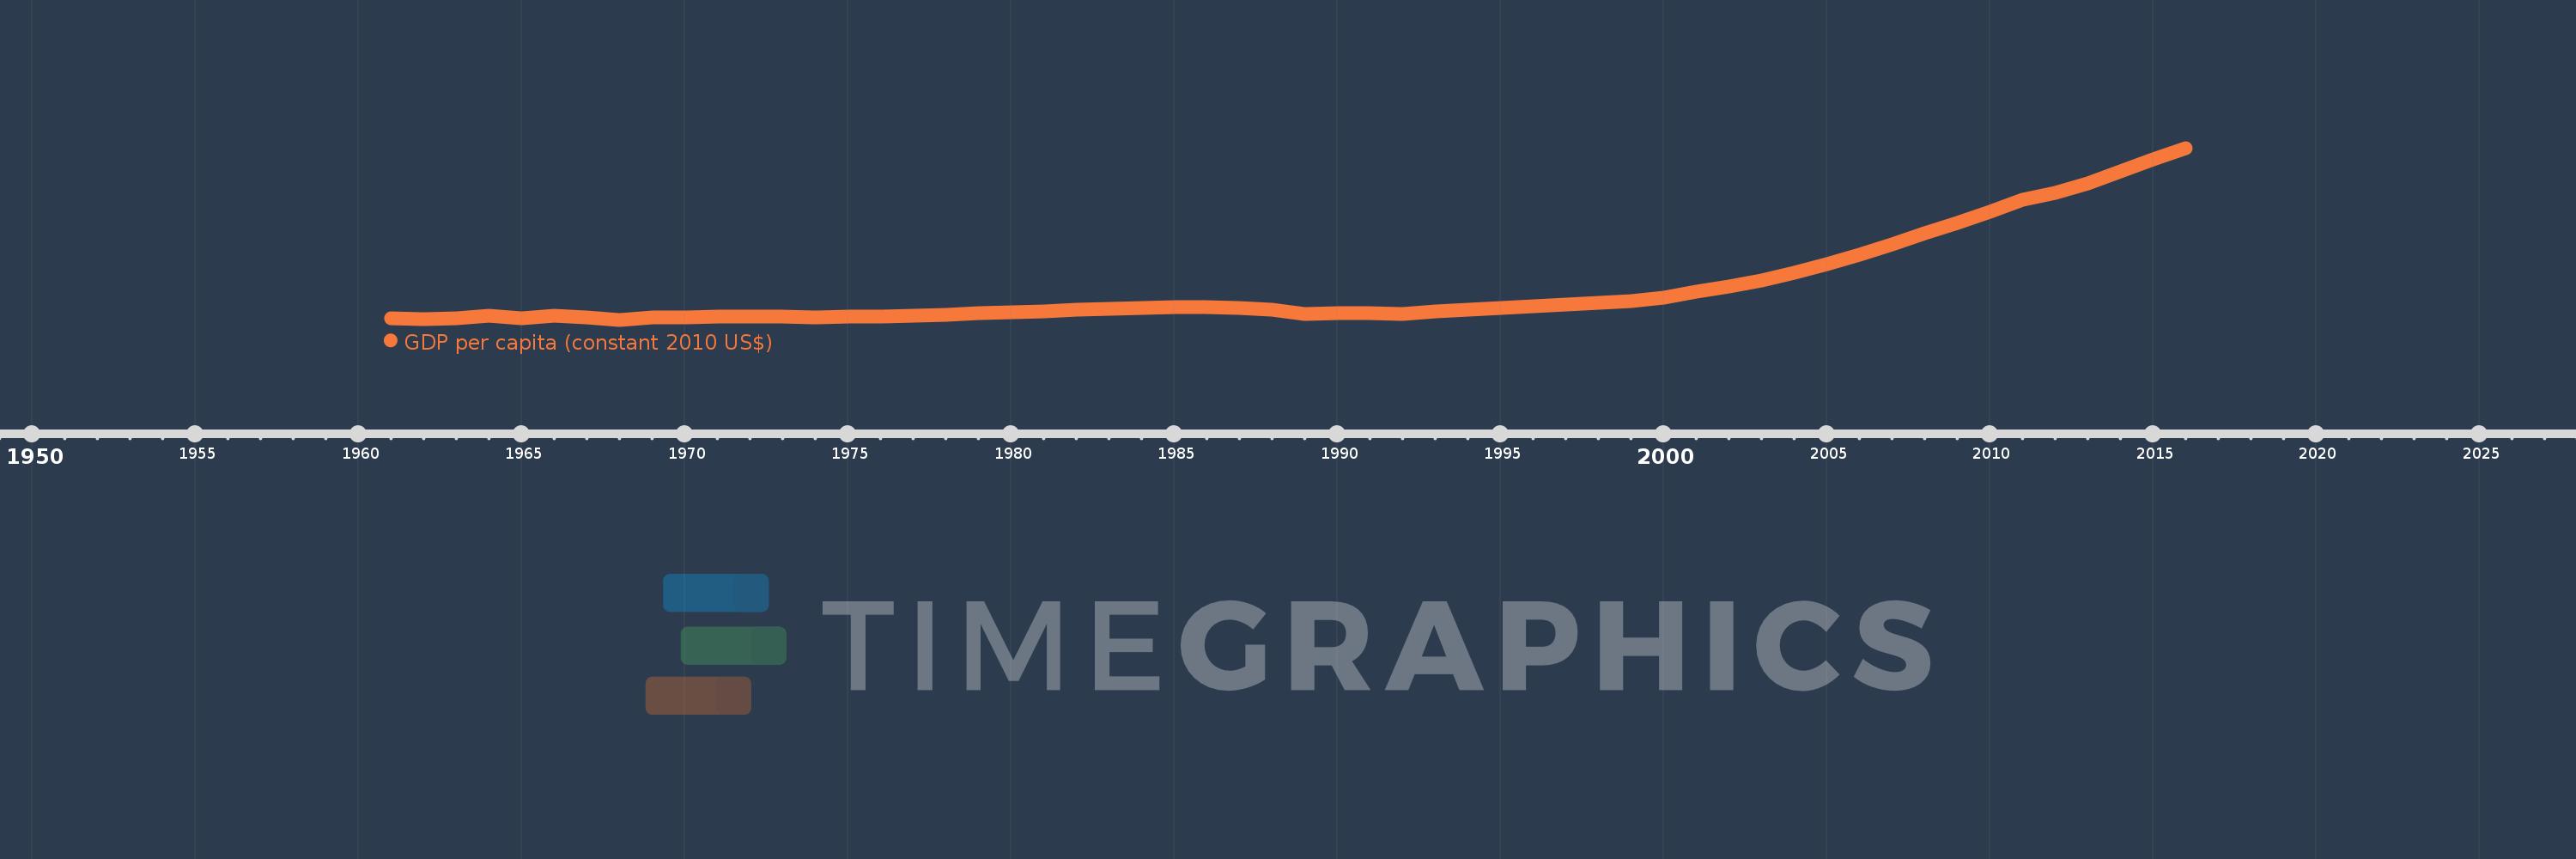
GDP per capita (constant 2010 US$)
2016,2015,2014,2013,2012,2011,2010,2009,2008,2007,2006,2005,2004,2003,2002,2001,2000,1999,1998,1997,1996,1995,1994,1993,1992,1991,1990,1989,1988,1987,1986,1985,1984,1983,1982,1981,1980,1979,1978,1977,1976,1975,1974,1973,1972,1971,1970,1969,1968,1967,1966,1965,1964,1963,1962,1961
Estas estadísticas en otros países:
AfghanistanAlbaniaAlgeriaAndorraAngolaAntigua and BarbudaArab WorldArgentinaArmeniaArubaAustraliaAustriaAzerbaijanBahamas, TheBahrainBangladeshBarbadosBelarusBelgiumBelizeBeninBermudaBhutanBoliviaBosnia and HerzegovinaBotswanaBrazilBrunei DarussalamBulgariaBurkina FasoBurundiCabo VerdeCambodiaCameroonCanadaCaribbean small statesCentral African RepublicCentral Europe and the BalticsChadChileChinaColombiaComorosCongo, Dem. Rep.Congo, Rep.Costa RicaCote d'IvoireCroatiaCubaCyprusCzech RepublicDenmarkDjiboutiDominicaDominican RepublicEarly-demographic dividendEast Asia & PacificEast Asia & Pacific (excluding high income)East Asia & Pacific (IDA & IBRD countries)EcuadorEgypt, Arab Rep.El SalvadorEquatorial GuineaEritreaEstoniaEthiopiaEuro areaEurope & Central AsiaEurope & Central Asia (excluding high income)Europe & Central Asia (IDA & IBRD countries)European UnionFaroe IslandsFijiFinlandFragile and conflict affected situationsFranceGabonGambia, TheGeorgiaGermanyGhanaGreeceGreenlandGrenadaGuatemalaGuineaGuinea-BissauGuyanaHaitiHeavily indebted poor countries (HIPC)High incomeHondurasHong Kong SAR, ChinaHungaryIBRD onlyIcelandIDA & IBRD totalIDA blendIDA onlyIDA totalIndiaIndonesiaIran, Islamic Rep.IraqIrelandIsle of ManIsraelItalyJamaicaJapanJordanKazakhstanKenyaKiribatiKorea, Rep.KosovoKuwaitKyrgyz RepublicLao PDRLate-demographic dividendLatin America & Caribbean Latin America & Caribbean (excluding high income)Latin America & the Caribbean (IDA & IBRD countries)LatviaLeast developed countries: UN classificationLebanonLesothoLiberiaLibyaLiechtensteinLithuaniaLow & middle incomeLow incomeLower middle incomeLuxembourgMacao SAR, ChinaMacedonia, FYRMadagascarMalawiMalaysiaMaldivesMaliMaltaMarshall IslandsMauritaniaMauritiusMexicoMicronesia, Fed. Sts.Middle East & North AfricaMiddle East & North Africa (excluding high income)Middle East & North Africa (IDA & IBRD countries)Middle incomeMoldovaMonacoMongoliaMontenegroMoroccoMozambiqueMyanmarNamibiaNauruNepalNetherlandsNew ZealandNicaraguaNigerNigeriaNorth AmericaNorwayOECD membersOmanOther small statesPacific island small statesPakistanPalauPanamaPapua New GuineaParaguayPeruPhilippinesPolandPortugalPost-demographic dividendPre-demographic dividendPuerto RicoQatarRomaniaRussian FederationRwandaSamoaSao Tome and PrincipeSaudi ArabiaSenegalSerbiaSeychellesSierra LeoneSingaporeSlovak RepublicSloveniaSmall statesSolomon IslandsSouth AfricaSouth AsiaSouth Asia (IDA & IBRD)South SudanSpainSri LankaSt. Kitts and NevisSt. LuciaSt. Vincent and the GrenadinesSub-Saharan Africa Sub-Saharan Africa (excluding high income)Sub-Saharan Africa (IDA & IBRD countries)SudanSurinameSwazilandSwedenSwitzerlandTajikistanTanzaniaThailandTimor-LesteTogoTongaTrinidad and TobagoTunisiaTurkeyTurkmenistanTuvaluUgandaUkraineUnited Arab EmiratesUnited KingdomUnited StatesUpper middle incomeUruguayUzbekistanVanuatuVenezuela, RBVietnamWest Bank and GazaWorldYemen, Rep.ZambiaZimbabwe línea de tiempo (timeline):
En esta escala de tiempo se presenta un gráfico de 1961 y 2016 de Myanmar. Los datos de 1960 están ausentes. El número de observaciones reales por fecha: 56.
Fuente (nombre):
Indicadores del desarrollo mundial
Fuente (organización):
World Bank national accounts data, and OECD National Accounts data files.
Categorías:
Economy & Growth
Se ha actualizado:
23 abr 2017 año
Los indicadores de los cambios de valor en los últimos años
Mínimo:
146.088
1 ene 1968 año
Máximo:
1.309 mil
1 ene 2016 año
A la fecha de observación
Valor
Cambio absoluto
El cambio con respecto al valor anterior
1 ene 1961 año
155.132
+155.132
0.0%
1 ene 1962 año
152.491
-2.641
-1.7%
1 ene 1963 año
155.293
+2.802
1.84%
1 ene 1964 año
172.184
+16.891
10.88%
1 ene 1965 año
158.418
-13.765
-7.99%
1 ene 1966 año
171.325
+12.906
8.15%
1 ene 1967 año
159.149
-12.176
-7.11%
1 ene 1968 año
146.088
-13.06
-8.21%
1 ene 1969 año
159.686
+13.597
9.31%
1 ene 1970 año
160.891
+1.205
0.75%
1 ene 1971 año
164.787
+3.897
2.42%
1 ene 1972 año
167.459
+2.672
1.62%
1 ene 1973 año
167.444
-0.015
-0.01%
1 ene 1974 año
161.892
-5.552
-3.32%
1 ene 1975 año
166.51
+4.618
2.85%
1 ene 1976 año
169.328
+2.818
1.69%
1 ene 1977 año
175.395
+6.067
3.58%
1 ene 1978 año
181.49
+6.094
3.47%
1 ene 1979 año
188.823
+7.333
4.04%
1 ene 1980 año
194.042
+5.22
2.76%
1 ene 1981 año
204.617
+10.575
5.45%
1 ene 1982 año
212.63
+8.013
3.92%
1 ene 1983 año
219.451
+6.821
3.21%
1 ene 1984 año
224.005
+4.554
2.08%
1 ene 1985 año
230.029
+6.024
2.69%
1 ene 1986 año
231.769
+1.74
0.76%
1 ene 1987 año
224.878
-6.891
-2.97%
1 ene 1988 año
211.898
-12.981
-5.77%
1 ene 1989 año
184.586
-27.312
-12.89%
1 ene 1990 año
188.315
+3.729
2.02%
1 ene 1991 año
190.726
+2.412
1.28%
1 ene 1992 año
186.902
-3.825
-2.01%
1 ene 1993 año
202.4
+15.499
8.29%
1 ene 1994 año
212.086
+9.686
4.79%
1 ene 1995 año
225.253
+13.167
6.21%
1 ene 1996 año
237.957
+12.704
5.64%
1 ene 1997 año
250.044
+12.087
5.08%
1 ene 1998 año
260.693
+10.649
4.26%
1 ene 1999 año
272.345
+11.652
4.47%
1 ene 2000 año
298.322
+25.977
9.54%
1 ene 2001 año
335.322
+37.0
12.4%
1 ene 2002 año
369.287
+33.965
10.13%
1 ene 2003 año
409.496
+40.209
10.89%
1 ene 2004 año
461.805
+52.309
12.77%
1 ene 2005 año
519.891
+58.086
12.58%
1 ene 2006 año
585.686
+65.796
12.66%
1 ene 2007 año
657.394
+71.707
12.24%
1 ene 2008 año
731.24
+73.846
11.23%
1 ene 2009 año
800.999
+69.758
9.54%
1 ene 2010 año
879.648
+78.649
9.82%
1 ene 2011 año
957.625
+77.977
8.86%
1 ene 2012 año
1.004 mil
+45.933
4.8%
1 ene 2013 año
1.069 mil
+65.01
6.48%
1 ene 2014 año
1.149 mil
+80.416
7.53%
1 ene 2015 año
1.23 mil
+81.292
7.08%
1 ene 2016 año
1.309 mil
+78.471
6.38%
Ranking de los países por los datos estadísticos actuales


Comentarios: