29
/es/
es
AIzaSyAYiBZKx7MnpbEhh9jyipgxe19OcubqV5w
April 1, 2024
84997
Bermuda
BMU
true
2
1
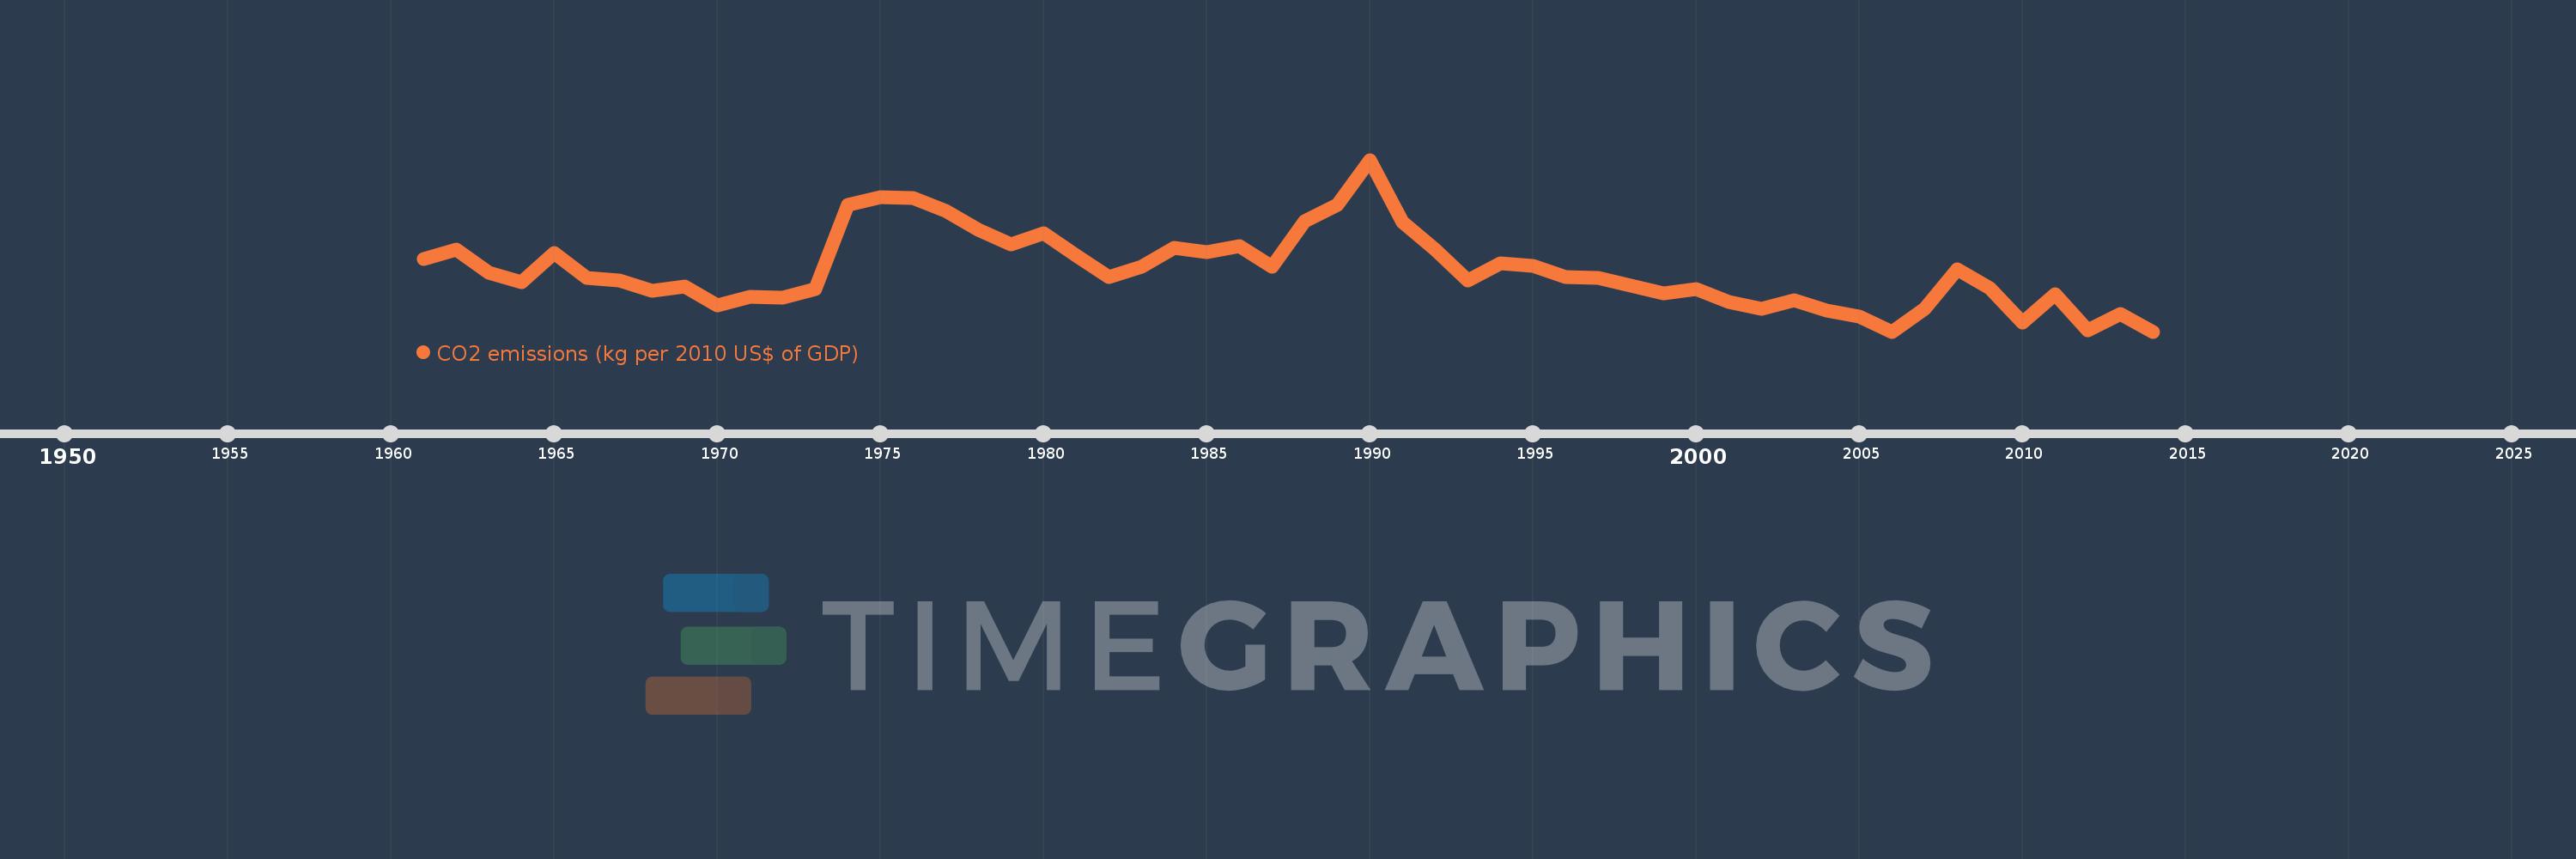
CO2 emissions (kg per 2010 US$ of GDP)
2014,2013,2012,2011,2010,2009,2008,2007,2006,2005,2004,2003,2002,2001,2000,1999,1998,1997,1996,1995,1994,1993,1992,1991,1990,1989,1988,1987,1986,1985,1984,1983,1982,1981,1980,1979,1978,1977,1976,1975,1974,1973,1972,1971,1970,1969,1968,1967,1966,1965,1964,1963,1962,1961
Estas estadísticas en otros países:
AfghanistanAlbaniaAlgeriaAndorraAngolaAntigua and BarbudaArab WorldArgentinaArmeniaArubaAustraliaAustriaAzerbaijanBahamas, TheBahrainBangladeshBarbadosBelarusBelgiumBelizeBeninBermudaBhutanBoliviaBosnia and HerzegovinaBotswanaBrazilBrunei DarussalamBulgariaBurkina FasoBurundiCabo VerdeCambodiaCameroonCanadaCaribbean small statesCentral African RepublicCentral Europe and the BalticsChadChileChinaColombiaComorosCongo, Dem. Rep.Congo, Rep.Costa RicaCote d'IvoireCroatiaCubaCyprusCzech RepublicDenmarkDjiboutiDominicaDominican RepublicEarly-demographic dividendEast Asia & PacificEast Asia & Pacific (excluding high income)East Asia & Pacific (IDA & IBRD countries)EcuadorEgypt, Arab Rep.El SalvadorEquatorial GuineaEritreaEstoniaEthiopiaEuro areaEurope & Central AsiaEurope & Central Asia (excluding high income)Europe & Central Asia (IDA & IBRD countries)European UnionFaroe IslandsFijiFinlandFragile and conflict affected situationsFranceGabonGambia, TheGeorgiaGermanyGhanaGreeceGreenlandGrenadaGuatemalaGuineaGuinea-BissauGuyanaHaitiHeavily indebted poor countries (HIPC)High incomeHondurasHong Kong SAR, ChinaHungaryIBRD onlyIcelandIDA & IBRD totalIDA blendIDA onlyIDA totalIndiaIndonesiaIran, Islamic Rep.IraqIrelandIsraelItalyJamaicaJapanJordanKazakhstanKenyaKiribatiKorea, Rep.KuwaitKyrgyz RepublicLao PDRLate-demographic dividendLatin America & Caribbean Latin America & Caribbean (excluding high income)Latin America & the Caribbean (IDA & IBRD countries)LatviaLeast developed countries: UN classificationLebanonLesothoLiberiaLibyaLiechtensteinLithuaniaLow & middle incomeLow incomeLower middle incomeLuxembourgMacao SAR, ChinaMacedonia, FYRMadagascarMalawiMalaysiaMaldivesMaliMaltaMarshall IslandsMauritaniaMauritiusMexicoMicronesia, Fed. Sts.Middle East & North AfricaMiddle East & North Africa (excluding high income)Middle East & North Africa (IDA & IBRD countries)Middle incomeMoldovaMongoliaMontenegroMoroccoMozambiqueMyanmarNamibiaNauruNepalNetherlandsNew ZealandNicaraguaNigerNigeriaNorth AmericaNorwayOECD membersOmanOther small statesPacific island small statesPakistanPalauPanamaPapua New GuineaParaguayPeruPhilippinesPolandPortugalPost-demographic dividendPre-demographic dividendQatarRomaniaRussian FederationRwandaSamoaSao Tome and PrincipeSaudi ArabiaSenegalSerbiaSeychellesSierra LeoneSingaporeSlovak RepublicSloveniaSmall statesSolomon IslandsSouth AfricaSouth AsiaSouth Asia (IDA & IBRD)South SudanSpainSri LankaSt. Kitts and NevisSt. LuciaSt. Vincent and the GrenadinesSub-Saharan Africa Sub-Saharan Africa (excluding high income)Sub-Saharan Africa (IDA & IBRD countries)SudanSurinameSwazilandSwedenSwitzerlandTajikistanTanzaniaThailandTimor-LesteTogoTongaTrinidad and TobagoTunisiaTurkeyTurkmenistanUgandaUkraineUnited Arab EmiratesUnited KingdomUnited StatesUpper middle incomeUruguayUzbekistanVanuatuVenezuela, RBVietnamWest Bank and GazaWorldYemen, Rep.ZambiaZimbabwe línea de tiempo (timeline):
En esta escala de tiempo se presenta un gráfico de 1961 y 2014 de Bermuda. Los datos de 1960 están ausentes. El número de observaciones reales por fecha: 54.
Fuente (nombre):
Indicadores del desarrollo mundial
Fuente (organización):
Carbon Dioxide Information Analysis Center, Environmental Sciences Division, Oak Ridge National Laboratory, Tennessee, United States.
Categorías:
Climate Change, Environment
Se ha actualizado:
23 abr 2017 año
Los indicadores de los cambios de valor en los últimos años
Mínimo:
0.07
1 ene 2006 año
Máximo:
0.208
1 ene 1990 año
A la fecha de observación
Valor
Cambio absoluto
El cambio con respecto al valor anterior
1 ene 1961 año
0.128
+0.128
0.0%
1 ene 1962 año
0.136
+0.008
6.64%
1 ene 1963 año
0.117
-0.019
-14.25%
1 ene 1964 año
0.11
-0.007
-5.66%
1 ene 1965 año
0.133
+0.023
20.73%
1 ene 1966 año
0.113
-0.02
-14.96%
1 ene 1967 año
0.111
-0.002
-1.85%
1 ene 1968 año
0.103
-0.008
-6.9%
1 ene 1969 año
0.106
+0.003
3.0%
1 ene 1970 año
0.091
-0.015
-14.42%
1 ene 1971 año
0.098
+0.007
8.0%
1 ene 1972 año
0.097
-0.002
-1.76%
1 ene 1973 año
0.104
+0.007
7.57%
1 ene 1974 año
0.172
+0.068
65.66%
1 ene 1975 año
0.178
+0.006
3.4%
1 ene 1976 año
0.177
-0.001
-0.45%
1 ene 1977 año
0.167
-0.011
-6.0%
1 ene 1978 año
0.152
-0.014
-8.52%
1 ene 1979 año
0.14
-0.012
-7.79%
1 ene 1980 año
0.149
+0.009
6.34%
1 ene 1981 año
0.131
-0.019
-12.51%
1 ene 1982 año
0.114
-0.017
-13.0%
1 ene 1983 año
0.122
+0.009
7.57%
1 ene 1984 año
0.137
+0.014
11.65%
1 ene 1985 año
0.134
-0.003
-2.1%
1 ene 1986 año
0.139
+0.005
3.73%
1 ene 1987 año
0.122
-0.017
-12.35%
1 ene 1988 año
0.159
+0.037
30.75%
1 ene 1989 año
0.172
+0.013
8.42%
1 ene 1990 año
0.208
+0.035
20.49%
1 ene 1991 año
0.158
-0.05
-23.96%
1 ene 1992 año
0.136
-0.021
-13.61%
1 ene 1993 año
0.111
-0.025
-18.47%
1 ene 1994 año
0.125
+0.013
12.08%
1 ene 1995 año
0.123
-0.002
-1.38%
1 ene 1996 año
0.114
-0.009
-7.25%
1 ene 1997 año
0.113
-0.001
-0.94%
1 ene 1998 año
0.107
-0.006
-5.17%
1 ene 1999 año
0.101
-0.006
-5.32%
1 ene 2000 año
0.104
+0.002
2.32%
1 ene 2001 año
0.094
-0.01
-9.24%
1 ene 2002 año
0.088
-0.006
-6.74%
1 ene 2003 año
0.095
+0.007
7.89%
1 ene 2004 año
0.087
-0.008
-8.31%
1 ene 2005 año
0.082
-0.005
-5.32%
1 ene 2006 año
0.07
-0.012
-14.34%
1 ene 2007 año
0.088
+0.017
24.58%
1 ene 2008 año
0.12
+0.032
36.26%
1 ene 2009 año
0.105
-0.015
-12.39%
1 ene 2010 año
0.077
-0.027
-26.04%
1 ene 2011 año
0.1
+0.022
28.5%
1 ene 2012 año
0.071
-0.028
-28.38%
1 ene 2013 año
0.084
+0.013
17.73%
1 ene 2014 año
0.07
-0.013
-16.07%
Ranking de los países por los datos estadísticos actuales


Comentarios: