29
/es/
es
AIzaSyAYiBZKx7MnpbEhh9jyipgxe19OcubqV5w
April 1, 2024
266637
Trinidad and Tobago
TTO
true
2
1
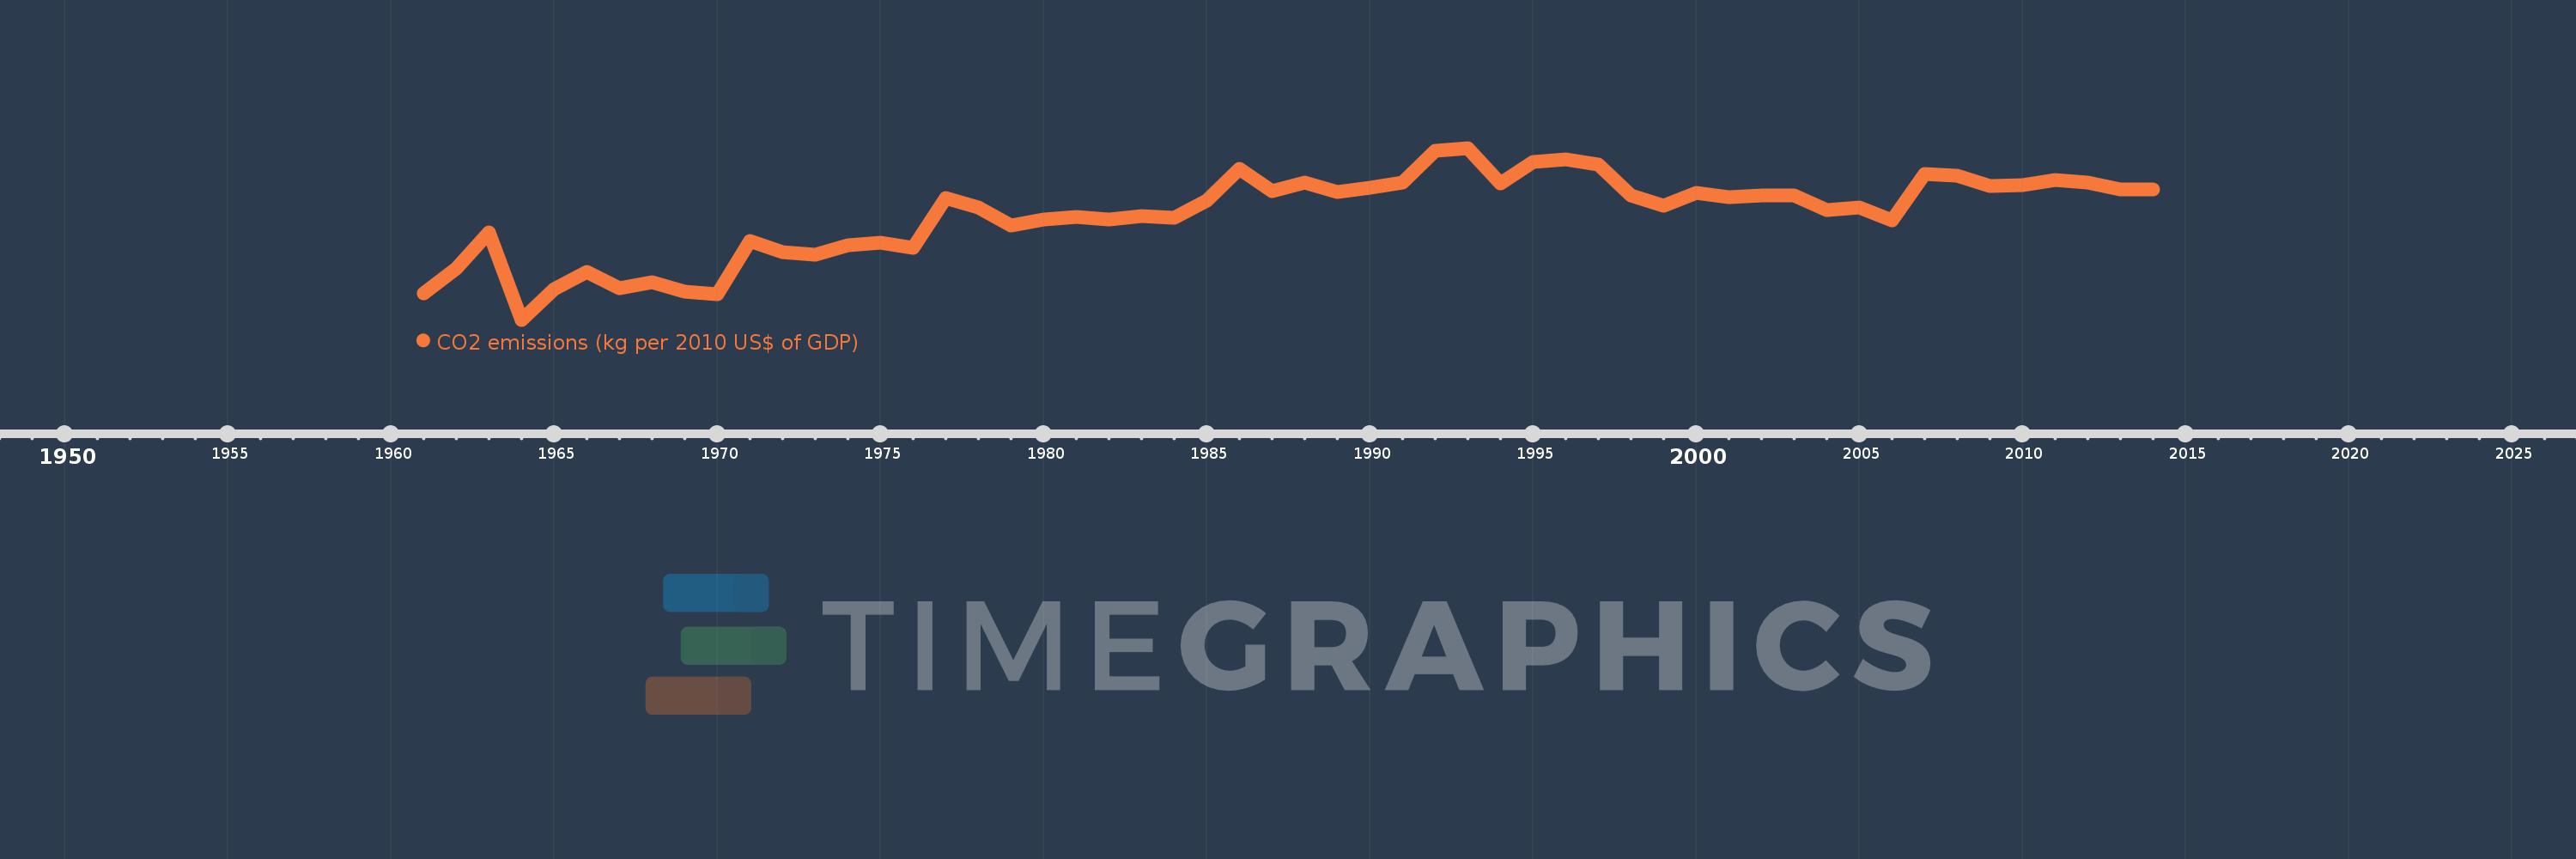
CO2 emissions (kg per 2010 US$ of GDP)
2014,2013,2012,2011,2010,2009,2008,2007,2006,2005,2004,2003,2002,2001,2000,1999,1998,1997,1996,1995,1994,1993,1992,1991,1990,1989,1988,1987,1986,1985,1984,1983,1982,1981,1980,1979,1978,1977,1976,1975,1974,1973,1972,1971,1970,1969,1968,1967,1966,1965,1964,1963,1962,1961
Estas estadísticas en otros países:
AfghanistanAlbaniaAlgeriaAndorraAngolaAntigua and BarbudaArab WorldArgentinaArmeniaArubaAustraliaAustriaAzerbaijanBahamas, TheBahrainBangladeshBarbadosBelarusBelgiumBelizeBeninBermudaBhutanBoliviaBosnia and HerzegovinaBotswanaBrazilBrunei DarussalamBulgariaBurkina FasoBurundiCabo VerdeCambodiaCameroonCanadaCaribbean small statesCentral African RepublicCentral Europe and the BalticsChadChileChinaColombiaComorosCongo, Dem. Rep.Congo, Rep.Costa RicaCote d'IvoireCroatiaCubaCyprusCzech RepublicDenmarkDjiboutiDominicaDominican RepublicEarly-demographic dividendEast Asia & PacificEast Asia & Pacific (excluding high income)East Asia & Pacific (IDA & IBRD countries)EcuadorEgypt, Arab Rep.El SalvadorEquatorial GuineaEritreaEstoniaEthiopiaEuro areaEurope & Central AsiaEurope & Central Asia (excluding high income)Europe & Central Asia (IDA & IBRD countries)European UnionFaroe IslandsFijiFinlandFragile and conflict affected situationsFranceGabonGambia, TheGeorgiaGermanyGhanaGreeceGreenlandGrenadaGuatemalaGuineaGuinea-BissauGuyanaHaitiHeavily indebted poor countries (HIPC)High incomeHondurasHong Kong SAR, ChinaHungaryIBRD onlyIcelandIDA & IBRD totalIDA blendIDA onlyIDA totalIndiaIndonesiaIran, Islamic Rep.IraqIrelandIsraelItalyJamaicaJapanJordanKazakhstanKenyaKiribatiKorea, Rep.KuwaitKyrgyz RepublicLao PDRLate-demographic dividendLatin America & Caribbean Latin America & Caribbean (excluding high income)Latin America & the Caribbean (IDA & IBRD countries)LatviaLeast developed countries: UN classificationLebanonLesothoLiberiaLibyaLiechtensteinLithuaniaLow & middle incomeLow incomeLower middle incomeLuxembourgMacao SAR, ChinaMacedonia, FYRMadagascarMalawiMalaysiaMaldivesMaliMaltaMarshall IslandsMauritaniaMauritiusMexicoMicronesia, Fed. Sts.Middle East & North AfricaMiddle East & North Africa (excluding high income)Middle East & North Africa (IDA & IBRD countries)Middle incomeMoldovaMongoliaMontenegroMoroccoMozambiqueMyanmarNamibiaNauruNepalNetherlandsNew ZealandNicaraguaNigerNigeriaNorth AmericaNorwayOECD membersOmanOther small statesPacific island small statesPakistanPalauPanamaPapua New GuineaParaguayPeruPhilippinesPolandPortugalPost-demographic dividendPre-demographic dividendQatarRomaniaRussian FederationRwandaSamoaSao Tome and PrincipeSaudi ArabiaSenegalSerbiaSeychellesSierra LeoneSingaporeSlovak RepublicSloveniaSmall statesSolomon IslandsSouth AfricaSouth AsiaSouth Asia (IDA & IBRD)South SudanSpainSri LankaSt. Kitts and NevisSt. LuciaSt. Vincent and the GrenadinesSub-Saharan Africa Sub-Saharan Africa (excluding high income)Sub-Saharan Africa (IDA & IBRD countries)SudanSurinameSwazilandSwedenSwitzerlandTajikistanTanzaniaThailandTimor-LesteTogoTongaTrinidad and TobagoTunisiaTurkeyTurkmenistanUgandaUkraineUnited Arab EmiratesUnited KingdomUnited StatesUpper middle incomeUruguayUzbekistanVanuatuVenezuela, RBVietnamWest Bank and GazaWorldYemen, Rep.ZambiaZimbabwe línea de tiempo (timeline):
En esta escala de tiempo se presenta un gráfico de 1961 y 2014 de Trinidad and Tobago. Los datos de 1960 están ausentes. El número de observaciones reales por fecha: 54.
Fuente (nombre):
Indicadores del desarrollo mundial
Fuente (organización):
Carbon Dioxide Information Analysis Center, Environmental Sciences Division, Oak Ridge National Laboratory, Tennessee, United States.
Categorías:
Climate Change, Environment
Se ha actualizado:
23 abr 2017 año
Los indicadores de los cambios de valor en los últimos años
Mínimo:
0.247
1 ene 1964 año
A la fecha de observación
Valor
Cambio absoluto
El cambio con respecto al valor anterior
1 ene 1961 año
0.604
+0.604
0.0%
1 ene 1962 año
0.944
+0.34
56.32%
1 ene 1963 año
1.445
+0.501
53.09%
1 ene 1964 año
0.247
-1.198
-82.87%
1 ene 1965 año
0.667
+0.419
169.36%
1 ene 1966 año
0.906
+0.24
35.96%
1 ene 1967 año
0.68
-0.226
-24.99%
1 ene 1968 año
0.762
+0.082
12.09%
1 ene 1969 año
0.631
-0.131
-17.2%
1 ene 1970 año
0.593
-0.037
-5.93%
1 ene 1971 año
1.321
+0.727
122.56%
1 ene 1972 año
1.177
-0.144
-10.87%
1 ene 1973 año
1.132
-0.045
-3.84%
1 ene 1974 año
1.27
+0.138
12.15%
1 ene 1975 año
1.308
+0.038
3.02%
1 ene 1976 año
1.234
-0.074
-5.66%
1 ene 1977 año
1.919
+0.685
55.55%
1 ene 1978 año
1.787
-0.133
-6.92%
1 ene 1979 año
1.539
-0.248
-13.86%
1 ene 1980 año
1.621
+0.082
5.32%
1 ene 1981 año
1.659
+0.038
2.36%
1 ene 1982 año
1.622
-0.037
-2.22%
1 ene 1983 año
1.668
+0.046
2.84%
1 ene 1984 año
1.646
-0.022
-1.35%
1 ene 1985 año
1.878
+0.232
14.12%
1 ene 1986 año
2.319
+0.44
23.45%
1 ene 1987 año
2.008
-0.311
-13.39%
1 ene 1988 año
2.12
+0.112
5.6%
1 ene 1989 año
1.999
-0.122
-5.75%
1 ene 1990 año
2.05
+0.052
2.58%
1 ene 1991 año
2.122
+0.072
3.5%
1 ene 1992 año
2.565
+0.443
20.87%
1 ene 1993 año
2.6
+0.035
1.37%
1 ene 1994 año
2.115
-0.485
-18.67%
1 ene 1995 año
2.41
+0.295
13.97%
1 ene 1996 año
2.449
+0.038
1.6%
1 ene 1997 año
2.376
-0.072
-2.95%
1 ene 1998 año
1.948
-0.428
-18.02%
1 ene 1999 año
1.81
-0.138
-7.08%
1 ene 2000 año
1.979
+0.169
9.34%
1 ene 2001 año
1.927
-0.052
-2.64%
1 ene 2002 año
1.947
+0.02
1.02%
1 ene 2003 año
1.953
+0.006
0.31%
1 ene 2004 año
1.749
-0.204
-10.44%
1 ene 2005 año
1.789
+0.04
2.3%
1 ene 2006 año
1.613
-0.176
-9.82%
1 ene 2007 año
2.242
+0.629
38.98%
1 ene 2008 año
2.222
-0.02
-0.9%
1 ene 2009 año
2.079
-0.143
-6.42%
1 ene 2010 año
2.092
+0.013
0.64%
1 ene 2011 año
2.162
+0.07
3.33%
1 ene 2012 año
2.123
-0.039
-1.82%
1 ene 2013 año
2.027
-0.095
-4.5%
1 ene 2014 año
2.026
-0.001
-0.07%
Ranking de los países por los datos estadísticos actuales


Comentarios: