29
/es/
es
AIzaSyAYiBZKx7MnpbEhh9jyipgxe19OcubqV5w
April 1, 2024
81815
Belgium
BEL
true
2
1
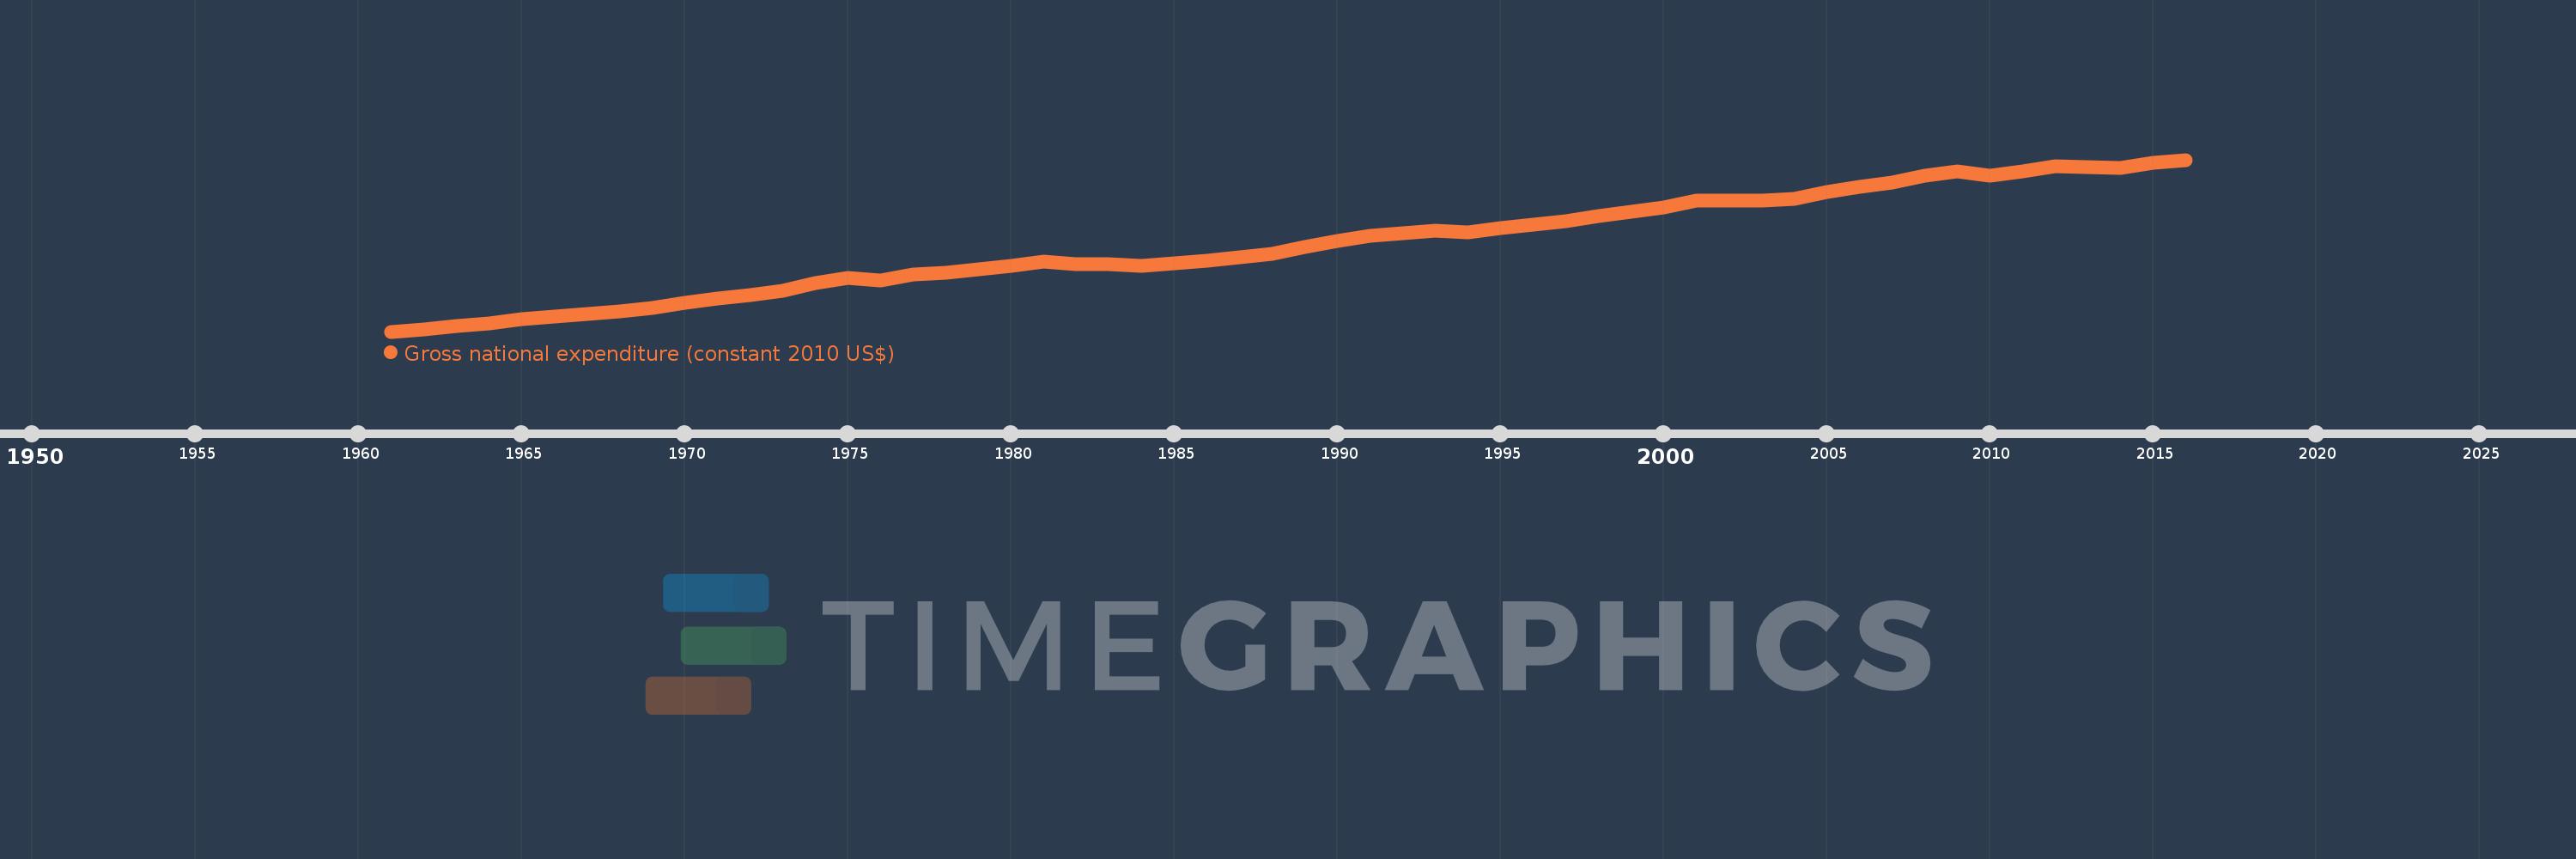
Gross national expenditure (constant 2010 US$)
2016,2015,2014,2013,2012,2011,2010,2009,2008,2007,2006,2005,2004,2003,2002,2001,2000,1999,1998,1997,1996,1995,1994,1993,1992,1991,1990,1989,1988,1987,1986,1985,1984,1983,1982,1981,1980,1979,1978,1977,1976,1975,1974,1973,1972,1971,1970,1969,1968,1967,1966,1965,1964,1963,1962,1961
Estas estadísticas en otros países:
AfghanistanAlbaniaAlgeriaAngolaAntigua and BarbudaArab WorldArgentinaArmeniaArubaAustraliaAustriaAzerbaijanBahamas, TheBahrainBangladeshBarbadosBelarusBelgiumBelizeBeninBermudaBhutanBoliviaBosnia and HerzegovinaBotswanaBrazilBrunei DarussalamBulgariaBurkina FasoBurundiCabo VerdeCambodiaCameroonCanadaCaribbean small statesCentral African RepublicCentral Europe and the BalticsChadChileChinaColombiaComorosCongo, Dem. Rep.Congo, Rep.Costa RicaCote d'IvoireCroatiaCubaCyprusCzech RepublicDenmarkDominicaDominican RepublicEarly-demographic dividendEast Asia & PacificEast Asia & Pacific (excluding high income)East Asia & Pacific (IDA & IBRD countries)EcuadorEgypt, Arab Rep.El SalvadorEquatorial GuineaEritreaEstoniaEuro areaEurope & Central AsiaEurope & Central Asia (excluding high income)Europe & Central Asia (IDA & IBRD countries)European UnionFaroe IslandsFijiFinlandFragile and conflict affected situationsFranceGabonGambia, TheGeorgiaGermanyGhanaGreeceGrenadaGuatemalaGuineaGuinea-BissauGuyanaHaitiHeavily indebted poor countries (HIPC)High incomeHondurasHong Kong SAR, ChinaHungaryIBRD onlyIcelandIDA & IBRD totalIDA blendIDA onlyIDA totalIndiaIndonesiaIran, Islamic Rep.IraqIrelandIsraelItalyJamaicaJapanJordanKazakhstanKenyaKiribatiKorea, Rep.KosovoKuwaitKyrgyz RepublicLao PDRLate-demographic dividendLatin America & Caribbean Latin America & Caribbean (excluding high income)Latin America & the Caribbean (IDA & IBRD countries)LatviaLeast developed countries: UN classificationLebanonLiberiaLibyaLithuaniaLow & middle incomeLow incomeLower middle incomeLuxembourgMacao SAR, ChinaMacedonia, FYRMadagascarMalawiMalaysiaMaldivesMaliMaltaMauritaniaMauritiusMexicoMiddle East & North AfricaMiddle East & North Africa (excluding high income)Middle East & North Africa (IDA & IBRD countries)Middle incomeMoldovaMongoliaMontenegroMoroccoMozambiqueMyanmarNamibiaNepalNetherlandsNew ZealandNicaraguaNigerNigeriaNorth AmericaNorwayOECD membersOmanOther small statesPacific island small statesPakistanPalauPanamaParaguayPeruPhilippinesPolandPortugalPost-demographic dividendPre-demographic dividendPuerto RicoQatarRomaniaRussian FederationRwandaSamoaSaudi ArabiaSenegalSerbiaSeychellesSierra LeoneSingaporeSlovak RepublicSloveniaSmall statesSolomon IslandsSouth AfricaSouth AsiaSouth Asia (IDA & IBRD)South SudanSpainSri LankaSt. Kitts and NevisSt. LuciaSt. Vincent and the GrenadinesSub-Saharan Africa Sub-Saharan Africa (excluding high income)Sub-Saharan Africa (IDA & IBRD countries)SudanSurinameSwazilandSwedenSwitzerlandTajikistanTanzaniaThailandTimor-LesteTogoTongaTrinidad and TobagoTunisiaTurkeyTurkmenistanUgandaUkraineUnited Arab EmiratesUnited KingdomUnited StatesUpper middle incomeUruguayUzbekistanVanuatuVenezuela, RBVietnamWest Bank and GazaWorldYemen, Rep.ZambiaZimbabwe línea de tiempo (timeline):
En esta escala de tiempo se presenta un gráfico de 1961 y 2016 de Belgium. Los datos de 1960 están ausentes. El número de observaciones reales por fecha: 56.
Fuente (nombre):
Indicadores del desarrollo mundial
Fuente (organización):
World Bank national accounts data, and OECD National Accounts data files.
Categorías:
Economy & Growth
Se ha actualizado:
23 abr 2017 año
Los indicadores de los cambios de valor en los últimos años
Mínimo:
123.137 bn
1 ene 1961 año
Máximo:
499.797 bn
1 ene 2016 año
A la fecha de observación
Valor
Cambio absoluto
El cambio con respecto al valor anterior
1 ene 1961 año
123.137 bn
+123.137 bn
0.0%
1 ene 1962 año
128.714 bn
+5.578 bn
4.53%
1 ene 1963 año
134.84 bn
+6.125 bn
4.76%
1 ene 1964 año
140.932 bn
+6.093 bn
4.52%
1 ene 1965 año
150.543 bn
+9.61 bn
6.82%
1 ene 1966 año
156.18 bn
+5.638 bn
3.74%
1 ene 1967 año
162.309 bn
+6.129 bn
3.92%
1 ene 1968 año
167.153 bn
+4.844 bn
2.98%
1 ene 1969 año
174.074 bn
+6.921 bn
4.14%
1 ene 1970 año
185.91 bn
+11.836 bn
6.8%
1 ene 1971 año
195.373 bn
+9.463 bn
5.09%
1 ene 1972 año
202.592 bn
+7.219 bn
3.69%
1 ene 1973 año
212.332 bn
+9.74 bn
4.81%
1 ene 1974 año
229.25 bn
+16.919 bn
7.97%
1 ene 1975 año
240.329 bn
+11.079 bn
4.83%
1 ene 1976 año
234.611 bn
-5.718 bn
-2.38%
1 ene 1977 año
247.664 bn
+13.053 bn
5.56%
1 ene 1978 año
251.782 bn
+4.118 bn
1.66%
1 ene 1979 año
259.292 bn
+7.511 bn
2.98%
1 ene 1980 año
267.658 bn
+8.366 bn
3.23%
1 ene 1981 año
277.181 bn
+9.523 bn
3.56%
1 ene 1982 año
270.759 bn
-6.422 bn
-2.32%
1 ene 1983 año
270.842 bn
+83.232 millones
0.03%
1 ene 1984 año
267.433 bn
-3.409 bn
-1.26%
1 ene 1985 año
273.736 bn
+6.303 bn
2.36%
1 ene 1986 año
278.418 bn
+4.681 bn
1.71%
1 ene 1987 año
285.584 bn
+7.167 bn
2.57%
1 ene 1988 año
294.24 bn
+8.656 bn
3.03%
1 ene 1989 año
309.079 bn
+14.839 bn
5.04%
1 ene 1990 año
321.969 bn
+12.89 bn
4.17%
1 ene 1991 año
332.553 bn
+10.584 bn
3.29%
1 ene 1992 año
338.352 bn
+5.798 bn
1.74%
1 ene 1993 año
344.328 bn
+5.976 bn
1.77%
1 ene 1994 año
341.172 bn
-3.156 bn
-0.92%
1 ene 1995 año
350.485 bn
+9.313 bn
2.73%
1 ene 1996 año
358.232 bn
+7.747 bn
2.21%
1 ene 1997 año
364.83 bn
+6.598 bn
1.84%
1 ene 1998 año
375.952 bn
+11.122 bn
3.05%
1 ene 1999 año
384.961 bn
+9.009 bn
2.4%
1 ene 2000 año
394.589 bn
+9.628 bn
2.5%
1 ene 2001 año
410.396 bn
+15.808 bn
4.01%
1 ene 2002 año
410.911 bn
+514.909 millones
0.13%
1 ene 2003 año
410.65 bn
-261.259 millones
-0.06%
1 ene 2004 año
413.509 bn
+2.859 bn
0.7%
1 ene 2005 año
428.416 bn
+14.907 bn
3.61%
1 ene 2006 año
440.452 bn
+12.036 bn
2.81%
1 ene 2007 año
449.025 bn
+8.573 bn
1.95%
1 ene 2008 año
464.489 bn
+15.464 bn
3.44%
1 ene 2009 año
474.282 bn
+9.793 bn
2.11%
1 ene 2010 año
465.126 bn
-9.157 bn
-1.93%
1 ene 2011 año
474.888 bn
+9.763 bn
2.1%
1 ene 2012 año
485.133 bn
+10.245 bn
2.16%
1 ene 2013 año
484.24 bn
-892.707 millones
-0.18%
1 ene 2014 año
481.764 bn
-2.477 bn
-0.51%
1 ene 2015 año
492.429 bn
+10.665 bn
2.21%
1 ene 2016 año
499.797 bn
+7.368 bn
1.5%
Ranking de los países por los datos estadísticos actuales


Comentarios: