29
/es/
es
AIzaSyAYiBZKx7MnpbEhh9jyipgxe19OcubqV5w
April 1, 2024
156057
Indonesia
IDN
true
2
1
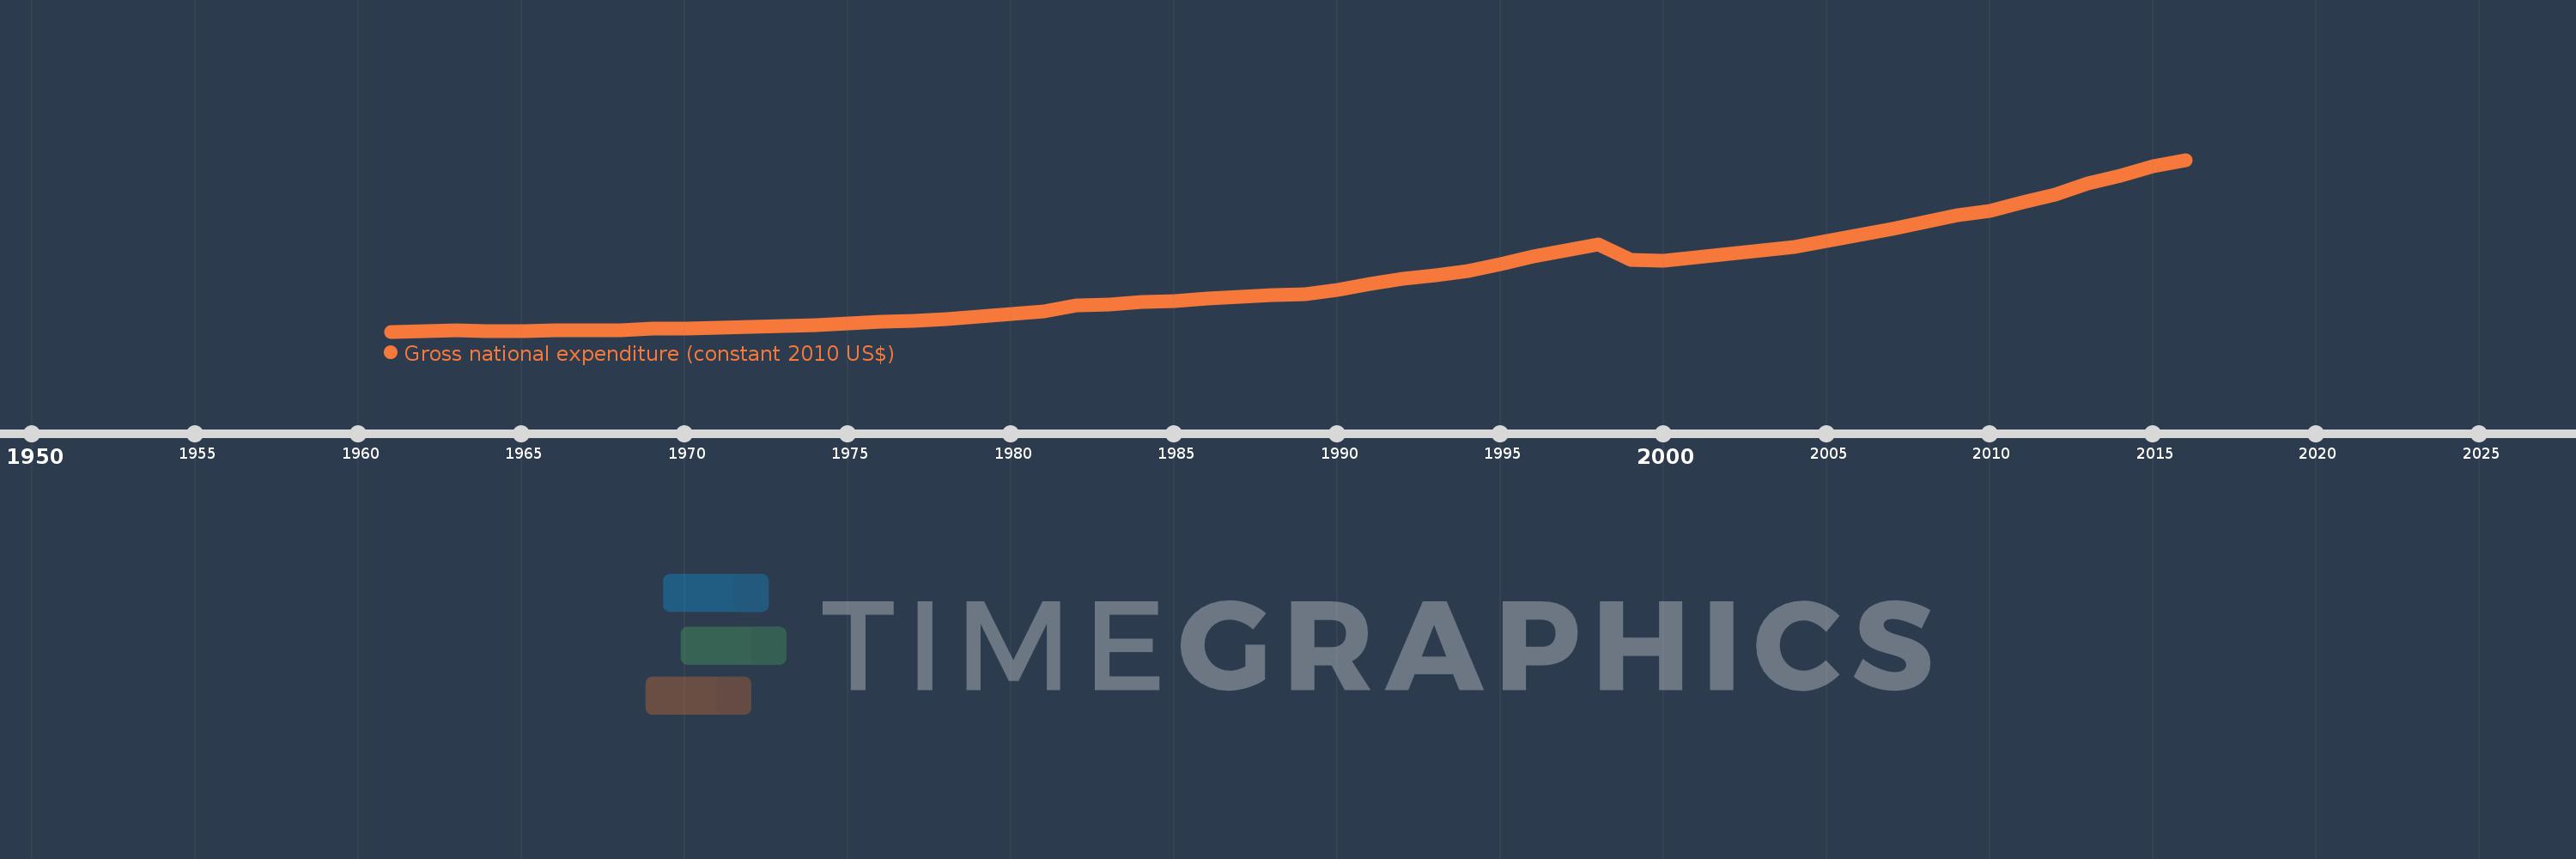
Gross national expenditure (constant 2010 US$)
2016,2015,2014,2013,2012,2011,2010,2009,2008,2007,2006,2005,2004,2003,2002,2001,2000,1999,1998,1997,1996,1995,1994,1993,1992,1991,1990,1989,1988,1987,1986,1985,1984,1983,1982,1981,1980,1979,1978,1977,1976,1975,1974,1973,1972,1971,1970,1969,1968,1967,1966,1965,1964,1963,1962,1961
Estas estadísticas en otros países:
AfghanistanAlbaniaAlgeriaAngolaAntigua and BarbudaArab WorldArgentinaArmeniaArubaAustraliaAustriaAzerbaijanBahamas, TheBahrainBangladeshBarbadosBelarusBelgiumBelizeBeninBermudaBhutanBoliviaBosnia and HerzegovinaBotswanaBrazilBrunei DarussalamBulgariaBurkina FasoBurundiCabo VerdeCambodiaCameroonCanadaCaribbean small statesCentral African RepublicCentral Europe and the BalticsChadChileChinaColombiaComorosCongo, Dem. Rep.Congo, Rep.Costa RicaCote d'IvoireCroatiaCubaCyprusCzech RepublicDenmarkDominicaDominican RepublicEarly-demographic dividendEast Asia & PacificEast Asia & Pacific (excluding high income)East Asia & Pacific (IDA & IBRD countries)EcuadorEgypt, Arab Rep.El SalvadorEquatorial GuineaEritreaEstoniaEuro areaEurope & Central AsiaEurope & Central Asia (excluding high income)Europe & Central Asia (IDA & IBRD countries)European UnionFaroe IslandsFijiFinlandFragile and conflict affected situationsFranceGabonGambia, TheGeorgiaGermanyGhanaGreeceGrenadaGuatemalaGuineaGuinea-BissauGuyanaHaitiHeavily indebted poor countries (HIPC)High incomeHondurasHong Kong SAR, ChinaHungaryIBRD onlyIcelandIDA & IBRD totalIDA blendIDA onlyIDA totalIndiaIndonesiaIran, Islamic Rep.IraqIrelandIsraelItalyJamaicaJapanJordanKazakhstanKenyaKiribatiKorea, Rep.KosovoKuwaitKyrgyz RepublicLao PDRLate-demographic dividendLatin America & Caribbean Latin America & Caribbean (excluding high income)Latin America & the Caribbean (IDA & IBRD countries)LatviaLeast developed countries: UN classificationLebanonLiberiaLibyaLithuaniaLow & middle incomeLow incomeLower middle incomeLuxembourgMacao SAR, ChinaMacedonia, FYRMadagascarMalawiMalaysiaMaldivesMaliMaltaMauritaniaMauritiusMexicoMiddle East & North AfricaMiddle East & North Africa (excluding high income)Middle East & North Africa (IDA & IBRD countries)Middle incomeMoldovaMongoliaMontenegroMoroccoMozambiqueMyanmarNamibiaNepalNetherlandsNew ZealandNicaraguaNigerNigeriaNorth AmericaNorwayOECD membersOmanOther small statesPacific island small statesPakistanPalauPanamaParaguayPeruPhilippinesPolandPortugalPost-demographic dividendPre-demographic dividendPuerto RicoQatarRomaniaRussian FederationRwandaSamoaSaudi ArabiaSenegalSerbiaSeychellesSierra LeoneSingaporeSlovak RepublicSloveniaSmall statesSolomon IslandsSouth AfricaSouth AsiaSouth Asia (IDA & IBRD)South SudanSpainSri LankaSt. Kitts and NevisSt. LuciaSt. Vincent and the GrenadinesSub-Saharan Africa Sub-Saharan Africa (excluding high income)Sub-Saharan Africa (IDA & IBRD countries)SudanSurinameSwazilandSwedenSwitzerlandTajikistanTanzaniaThailandTimor-LesteTogoTongaTrinidad and TobagoTunisiaTurkeyTurkmenistanUgandaUkraineUnited Arab EmiratesUnited KingdomUnited StatesUpper middle incomeUruguayUzbekistanVanuatuVenezuela, RBVietnamWest Bank and GazaWorldYemen, Rep.ZambiaZimbabwe línea de tiempo (timeline):
En esta escala de tiempo se presenta un gráfico de 1961 y 2016 de Indonesia. Los datos de 1960 están ausentes. El número de observaciones reales por fecha: 56.
Fuente (nombre):
Indicadores del desarrollo mundial
Fuente (organización):
World Bank national accounts data, and OECD National Accounts data files.
Categorías:
Economy & Growth
Se ha actualizado:
23 abr 2017 año
Los indicadores de los cambios de valor en los últimos años
Mínimo:
41.507 bn
1 ene 1961 año
Máximo:
972.818 bn
1 ene 2016 año
A la fecha de observación
Valor
Cambio absoluto
El cambio con respecto al valor anterior
1 ene 1961 año
41.507 bn
+41.507 bn
0.0%
1 ene 1962 año
44.843 bn
+3.336 bn
8.04%
1 ene 1963 año
46.967 bn
+2.124 bn
4.74%
1 ene 1964 año
45.138 bn
-1.829 bn
-3.89%
1 ene 1965 año
45.873 bn
+735.811 millones
1.63%
1 ene 1966 año
46.551 bn
+677.265 millones
1.48%
1 ene 1967 año
48.147 bn
+1.596 bn
3.43%
1 ene 1968 año
49.795 bn
+1.648 bn
3.42%
1 ene 1969 año
55.817 bn
+6.022 bn
12.09%
1 ene 1970 año
59.613 bn
+3.796 bn
6.8%
1 ene 1971 año
63.221 bn
+3.609 bn
6.05%
1 ene 1972 año
67.617 bn
+4.396 bn
6.95%
1 ene 1973 año
70.501 bn
+2.884 bn
4.27%
1 ene 1974 año
77.477 bn
+6.976 bn
9.89%
1 ene 1975 año
87.724 bn
+10.247 bn
13.23%
1 ene 1976 año
97.116 bn
+9.392 bn
10.71%
1 ene 1977 año
101.412 bn
+4.296 bn
4.42%
1 ene 1978 año
108.851 bn
+7.44 bn
7.34%
1 ene 1979 año
123.267 bn
+14.416 bn
13.24%
1 ene 1980 año
135.222 bn
+11.955 bn
9.7%
1 ene 1981 año
148.759 bn
+13.537 bn
10.01%
1 ene 1982 año
181.95 bn
+33.191 bn
22.31%
1 ene 1983 año
187.993 bn
+6.043 bn
3.32%
1 ene 1984 año
201.095 bn
+13.102 bn
6.97%
1 ene 1985 año
209.123 bn
+8.028 bn
3.99%
1 ene 1986 año
221.428 bn
+12.305 bn
5.88%
1 ene 1987 año
230.611 bn
+9.183 bn
4.15%
1 ene 1988 año
237.554 bn
+6.944 bn
3.01%
1 ene 1989 año
243.425 bn
+5.87 bn
2.47%
1 ene 1990 año
267.577 bn
+24.152 bn
9.92%
1 ene 1991 año
300.465 bn
+32.888 bn
12.29%
1 ene 1992 año
325.756 bn
+25.291 bn
8.42%
1 ene 1993 año
346.192 bn
+20.435 bn
6.27%
1 ene 1994 año
370.085 bn
+23.893 bn
6.9%
1 ene 1995 año
404.921 bn
+34.837 bn
9.41%
1 ene 1996 año
449.766 bn
+44.844 bn
11.07%
1 ene 1997 año
483.44 bn
+33.674 bn
7.49%
1 ene 1998 año
513.873 bn
+30.433 bn
6.3%
1 ene 1999 año
431.308 bn
-82.565 bn
-16.07%
1 ene 2000 año
423.664 bn
-7.644 bn
-1.77%
1 ene 2001 año
442.301 bn
+18.637 bn
4.4%
1 ene 2002 año
461.794 bn
+19.493 bn
4.41%
1 ene 2003 año
480.317 bn
+18.523 bn
4.01%
1 ene 2004 año
499.445 bn
+19.128 bn
3.98%
1 ene 2005 año
534.74 bn
+35.295 bn
7.07%
1 ene 2006 año
565.849 bn
+31.109 bn
5.82%
1 ene 2007 año
595.696 bn
+29.847 bn
5.27%
1 ene 2008 año
634.077 bn
+38.381 bn
6.44%
1 ene 2009 año
672.693 bn
+38.616 bn
6.09%
1 ene 2010 año
695.827 bn
+23.134 bn
3.44%
1 ene 2011 año
740.772 bn
+44.944 bn
6.46%
1 ene 2012 año
785.682 bn
+44.91 bn
6.06%
1 ene 2013 año
846.199 bn
+60.517 bn
7.7%
1 ene 2014 año
888.434 bn
+42.235 bn
4.99%
1 ene 2015 año
935.985 bn
+47.551 bn
5.35%
1 ene 2016 año
972.818 bn
+36.833 bn
3.94%
Ranking de los países por los datos estadísticos actuales


Comentarios: