29
/es/
es
AIzaSyAYiBZKx7MnpbEhh9jyipgxe19OcubqV5w
April 1, 2024
79560
Barbados
BRB
true
2
1
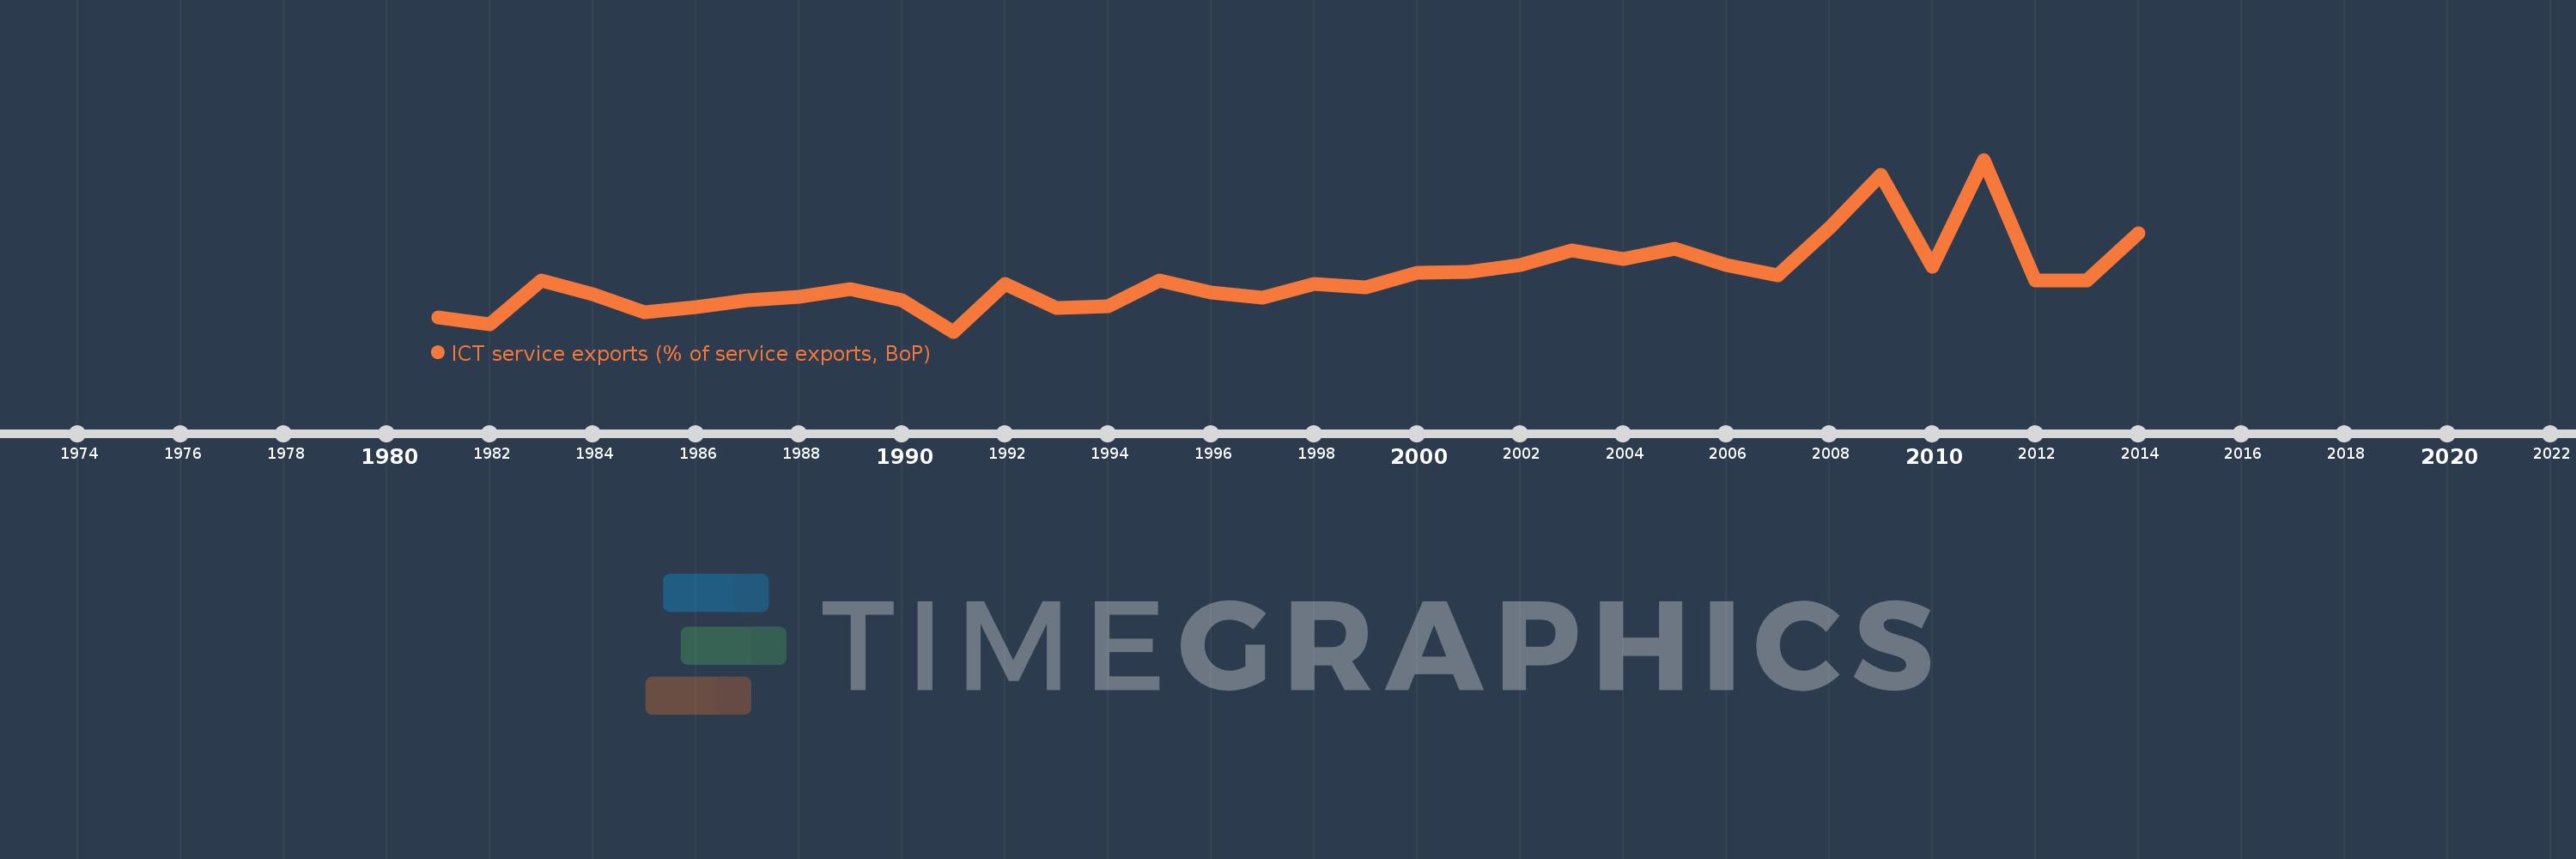
ICT service exports (% of service exports, BoP)
2014,2013,2012,2011,2010,2009,2008,2007,2006,2005,2004,2003,2002,2001,2000,1999,1998,1997,1996,1995,1994,1993,1992,1991,1990,1989,1988,1987,1986,1985,1984,1983,1982,1981
Estas estadísticas en otros países:
AfghanistanAlbaniaAlgeriaAngolaAntigua and BarbudaArgentinaArmeniaArubaAustraliaAustriaAzerbaijanBahrainBangladeshBarbadosBelarusBelgiumBelizeBeninBermudaBhutanBoliviaBosnia and HerzegovinaBotswanaBrazilBrunei DarussalamBulgariaBurkina FasoBurundiCabo VerdeCambodiaCameroonCanadaCaribbean small statesCentral Europe and the BalticsChileChinaColombiaComorosCongo, Dem. Rep.Congo, Rep.Costa RicaCote d'IvoireCroatiaCuracaoCyprusCzech RepublicDenmarkDjiboutiDominicaDominican RepublicEarly-demographic dividendEast Asia & PacificEast Asia & Pacific (excluding high income)East Asia & Pacific (IDA & IBRD countries)EcuadorEgypt, Arab Rep.El SalvadorEritreaEstoniaEthiopiaEuro areaEurope & Central AsiaEurope & Central Asia (excluding high income)Europe & Central Asia (IDA & IBRD countries)European UnionFaroe IslandsFijiFinlandFranceFrench PolynesiaGabonGambia, TheGeorgiaGermanyGreeceGrenadaGuatemalaGuineaGuinea-BissauGuyanaHeavily indebted poor countries (HIPC)High incomeHondurasHong Kong SAR, ChinaHungaryIBRD onlyIcelandIDA & IBRD totalIDA onlyIndiaIndonesiaIraqIrelandIsraelItalyJamaicaJapanJordanKazakhstanKenyaKorea, Rep.KosovoKuwaitKyrgyz RepublicLao PDRLate-demographic dividendLatin America & Caribbean Latin America & Caribbean (excluding high income)Latin America & the Caribbean (IDA & IBRD countries)LatviaLeast developed countries: UN classificationLebanonLesothoLithuaniaLow & middle incomeLow incomeLower middle incomeLuxembourgMacao SAR, ChinaMacedonia, FYRMadagascarMalawiMalaysiaMaliMaltaMauritaniaMauritiusMexicoMicronesia, Fed. Sts.Middle incomeMoldovaMongoliaMontenegroMoroccoMozambiqueMyanmarNamibiaNepalNetherlandsNew CaledoniaNew ZealandNicaraguaNigerNigeriaNorth AmericaNorwayOECD membersOmanPacific island small statesPakistanPalauPanamaPapua New GuineaParaguayPeruPhilippinesPolandPortugalPost-demographic dividendPre-demographic dividendRomaniaRussian FederationRwandaSamoaSao Tome and PrincipeSaudi ArabiaSenegalSerbiaSeychellesSierra LeoneSingaporeSint Maarten (Dutch part)Slovak RepublicSloveniaSolomon IslandsSouth AfricaSouth AsiaSouth Asia (IDA & IBRD)South SudanSpainSri LankaSt. Kitts and NevisSt. LuciaSt. Vincent and the GrenadinesSub-Saharan Africa Sub-Saharan Africa (excluding high income)Sub-Saharan Africa (IDA & IBRD countries)SudanSurinameSwazilandSwedenSwitzerlandSyrian Arab RepublicTajikistanTanzaniaThailandTogoTongaTrinidad and TobagoTunisiaTurkeyTuvaluUgandaUkraineUnited KingdomUnited StatesUpper middle incomeUruguayVanuatuVenezuela, RBWest Bank and GazaWorldYemen, Rep.ZambiaZimbabwe línea de tiempo (timeline):
En esta escala de tiempo se presenta un gráfico de 1981 y 2014 de Barbados. Los datos de 1980 están ausentes. El número de observaciones reales por fecha: 34.
Fuente (nombre):
Indicadores del desarrollo mundial
Fuente (organización):
International Monetary Fund, Balance of Payments Statistics Yearbook and data files.
Categorías:
Economy & Growth, Infrastructure, Trade
Se ha actualizado:
23 abr 2017 año
Los indicadores de los cambios de valor en los últimos años
Mínimo:
8.649
1 ene 1991 año
Máximo:
25.904
1 ene 2011 año
A la fecha de observación
Valor
Cambio absoluto
El cambio con respecto al valor anterior
1 ene 1981 año
10.065
+10.065
0.0%
1 ene 1982 año
9.346
-0.719
-7.14%
1 ene 1983 año
13.784
+4.437
47.48%
1 ene 1984 año
12.392
-1.391
-10.09%
1 ene 1985 año
10.6
-1.792
-14.46%
1 ene 1986 año
11.101
+0.501
4.73%
1 ene 1987 año
11.76
+0.659
5.93%
1 ene 1988 año
12.174
+0.414
3.52%
1 ene 1989 año
12.926
+0.752
6.18%
1 ene 1990 año
11.827
-1.099
-8.5%
1 ene 1991 año
8.649
-3.178
-26.87%
1 ene 1992 año
13.463
+4.815
55.67%
1 ene 1993 año
11.064
-2.399
-17.82%
1 ene 1994 año
11.235
+0.17
1.54%
1 ene 1995 año
13.804
+2.569
22.87%
1 ene 1996 año
12.548
-1.256
-9.1%
1 ene 1997 año
12.026
-0.523
-4.16%
1 ene 1998 año
13.474
+1.448
12.04%
1 ene 1999 año
13.119
-0.355
-2.64%
1 ene 2000 año
14.563
+1.445
11.01%
1 ene 2001 año
14.661
+0.098
0.67%
1 ene 2002 año
15.355
+0.693
4.73%
1 ene 2003 año
16.765
+1.41
9.19%
1 ene 2004 año
15.976
-0.789
-4.71%
1 ene 2005 año
17.008
+1.032
6.46%
1 ene 2006 año
15.32
-1.687
-9.92%
1 ene 2007 año
14.267
-1.053
-6.87%
1 ene 2008 año
19.038
+4.771
33.44%
1 ene 2009 año
24.393
+5.354
28.12%
1 ene 2010 año
15.137
-9.256
-37.95%
1 ene 2011 año
25.904
+10.767
71.13%
1 ene 2012 año
13.777
-12.127
-46.81%
1 ene 2013 año
13.799
+0.021
0.16%
1 ene 2014 año
18.499
+4.7
34.06%
Ranking de los países por los datos estadísticos actuales


Comentarios: