29
/es/
es
AIzaSyAYiBZKx7MnpbEhh9jyipgxe19OcubqV5w
April 1, 2024
256445
Sweden
SWE
true
2
1
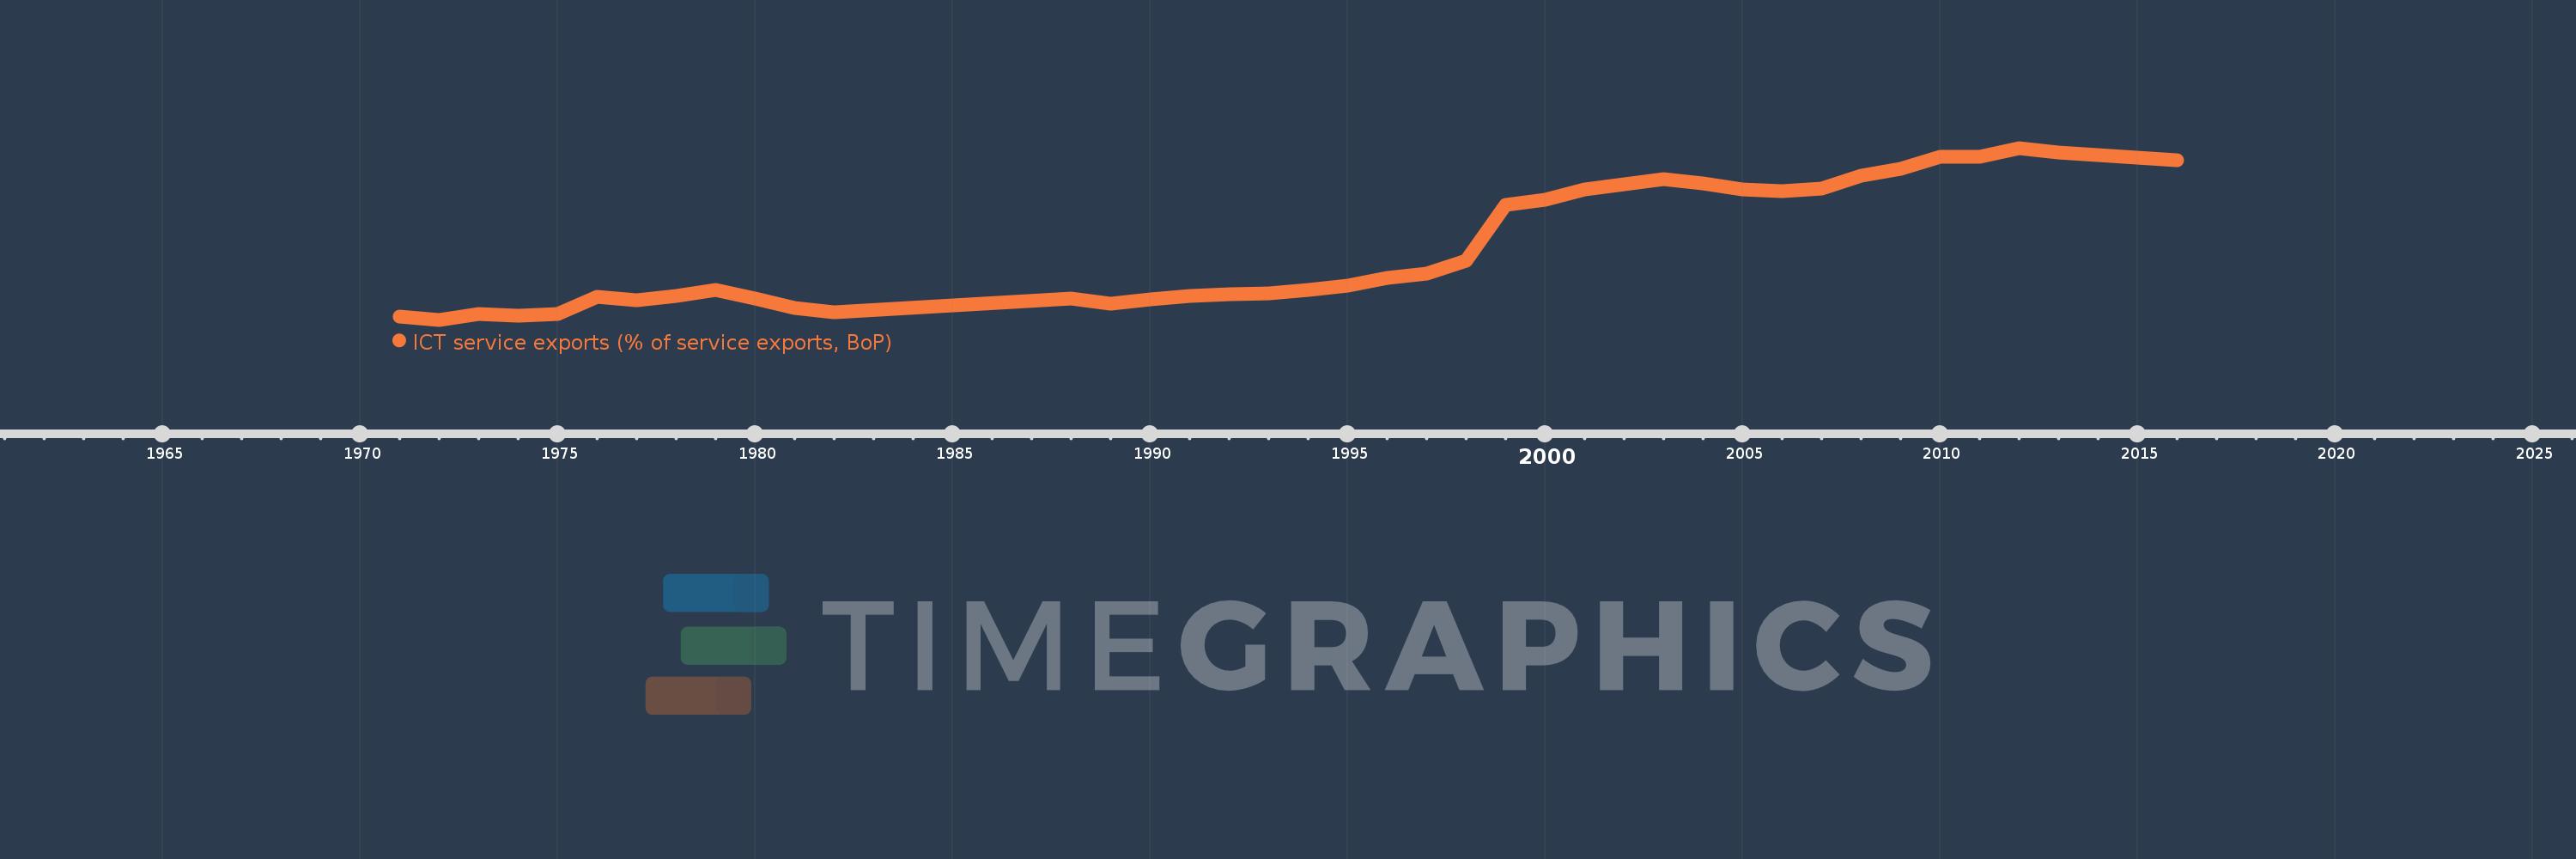
ICT service exports (% of service exports, BoP)
2016,2015,2014,2013,2012,2011,2010,2009,2008,2007,2006,2005,2004,2003,2002,2001,2000,1999,1998,1997,1996,1995,1994,1993,1992,1991,1990,1989,1988,1982,1981,1980,1979,1978,1977,1976,1975,1974,1973,1972,1971
Estas estadísticas en otros países:
AfghanistanAlbaniaAlgeriaAngolaAntigua and BarbudaArgentinaArmeniaArubaAustraliaAustriaAzerbaijanBahrainBangladeshBarbadosBelarusBelgiumBelizeBeninBermudaBhutanBoliviaBosnia and HerzegovinaBotswanaBrazilBrunei DarussalamBulgariaBurkina FasoBurundiCabo VerdeCambodiaCameroonCanadaCaribbean small statesCentral Europe and the BalticsChileChinaColombiaComorosCongo, Dem. Rep.Congo, Rep.Costa RicaCote d'IvoireCroatiaCuracaoCyprusCzech RepublicDenmarkDjiboutiDominicaDominican RepublicEarly-demographic dividendEast Asia & PacificEast Asia & Pacific (excluding high income)East Asia & Pacific (IDA & IBRD countries)EcuadorEgypt, Arab Rep.El SalvadorEritreaEstoniaEthiopiaEuro areaEurope & Central AsiaEurope & Central Asia (excluding high income)Europe & Central Asia (IDA & IBRD countries)European UnionFaroe IslandsFijiFinlandFranceFrench PolynesiaGabonGambia, TheGeorgiaGermanyGreeceGrenadaGuatemalaGuineaGuinea-BissauGuyanaHeavily indebted poor countries (HIPC)High incomeHondurasHong Kong SAR, ChinaHungaryIBRD onlyIcelandIDA & IBRD totalIDA onlyIndiaIndonesiaIraqIrelandIsraelItalyJamaicaJapanJordanKazakhstanKenyaKorea, Rep.KosovoKuwaitKyrgyz RepublicLao PDRLate-demographic dividendLatin America & Caribbean Latin America & Caribbean (excluding high income)Latin America & the Caribbean (IDA & IBRD countries)LatviaLeast developed countries: UN classificationLebanonLesothoLithuaniaLow & middle incomeLow incomeLower middle incomeLuxembourgMacao SAR, ChinaMacedonia, FYRMadagascarMalawiMalaysiaMaliMaltaMauritaniaMauritiusMexicoMicronesia, Fed. Sts.Middle incomeMoldovaMongoliaMontenegroMoroccoMozambiqueMyanmarNamibiaNepalNetherlandsNew CaledoniaNew ZealandNicaraguaNigerNigeriaNorth AmericaNorwayOECD membersOmanPacific island small statesPakistanPalauPanamaPapua New GuineaParaguayPeruPhilippinesPolandPortugalPost-demographic dividendPre-demographic dividendRomaniaRussian FederationRwandaSamoaSao Tome and PrincipeSaudi ArabiaSenegalSerbiaSeychellesSierra LeoneSingaporeSint Maarten (Dutch part)Slovak RepublicSloveniaSolomon IslandsSouth AfricaSouth AsiaSouth Asia (IDA & IBRD)South SudanSpainSri LankaSt. Kitts and NevisSt. LuciaSt. Vincent and the GrenadinesSub-Saharan Africa Sub-Saharan Africa (excluding high income)Sub-Saharan Africa (IDA & IBRD countries)SudanSurinameSwazilandSwedenSwitzerlandSyrian Arab RepublicTajikistanTanzaniaThailandTogoTongaTrinidad and TobagoTunisiaTurkeyTuvaluUgandaUkraineUnited KingdomUnited StatesUpper middle incomeUruguayVanuatuVenezuela, RBWest Bank and GazaWorldYemen, Rep.ZambiaZimbabwe línea de tiempo (timeline):
En esta escala de tiempo se presenta un gráfico de 1971 y 2016 de Sweden. Los datos de 1970 están ausentes. El número de observaciones reales por fecha: 41.
Fuente (nombre):
Indicadores del desarrollo mundial
Fuente (organización):
International Monetary Fund, Balance of Payments Statistics Yearbook and data files.
Categorías:
Economy & Growth, Infrastructure, Trade
Se ha actualizado:
23 abr 2017 año
Los indicadores de los cambios de valor en los últimos años
Mínimo:
8.702
1 ene 1972 año
Máximo:
48.502
1 ene 2012 año
A la fecha de observación
Valor
Cambio absoluto
El cambio con respecto al valor anterior
1 ene 1971 año
9.355
+9.355
0.0%
1 ene 1972 año
8.702
-0.653
-6.98%
1 ene 1973 año
9.957
+1.255
14.42%
1 ene 1974 año
9.698
-0.259
-2.6%
1 ene 1975 año
10.101
+0.403
4.16%
1 ene 1976 año
14.073
+3.972
39.33%
1 ene 1977 año
13.285
-0.788
-5.6%
1 ene 1978 año
14.145
+0.86
6.47%
1 ene 1979 año
15.534
+1.389
9.82%
1 ene 1980 año
13.527
-2.007
-12.92%
1 ene 1981 año
11.359
-2.169
-16.03%
1 ene 1982 año
10.487
-0.871
-7.67%
1 ene 1988 año
13.707
+3.22
30.7%
1 ene 1989 año
12.419
-1.289
-9.4%
1 ene 1990 año
13.414
+0.995
8.02%
1 ene 1991 año
14.199
+0.785
5.85%
1 ene 1992 año
14.666
+0.467
3.29%
1 ene 1993 año
14.765
+0.099
0.67%
1 ene 1994 año
15.576
+0.811
5.49%
1 ene 1995 año
16.563
+0.987
6.34%
1 ene 1996 año
18.32
+1.757
10.61%
1 ene 1997 año
19.455
+1.135
6.2%
1 ene 1998 año
22.377
+2.923
15.02%
1 ene 1999 año
35.333
+12.955
57.9%
1 ene 2000 año
36.403
+1.07
3.03%
1 ene 2001 año
38.949
+2.546
6.99%
1 ene 2002 año
40.153
+1.204
3.09%
1 ene 2003 año
41.261
+1.108
2.76%
1 ene 2004 año
40.273
-0.988
-2.4%
1 ene 2005 año
38.901
-1.372
-3.41%
1 ene 2006 año
38.491
-0.411
-1.06%
1 ene 2007 año
39.09
+0.6
1.56%
1 ene 2008 año
42.134
+3.044
7.79%
1 ene 2009 año
43.752
+1.618
3.84%
1 ene 2010 año
46.382
+2.63
6.01%
1 ene 2011 año
46.405
+0.023
0.05%
1 ene 2012 año
48.502
+2.097
4.52%
1 ene 2013 año
47.464
-1.038
-2.14%
1 ene 2014 año
46.835
-0.629
-1.33%
1 ene 2015 año
46.248
-0.587
-1.25%
1 ene 2016 año
45.664
-0.584
-1.26%
Ranking de los países por los datos estadísticos actuales


Comentarios: