29
/es/
es
AIzaSyAYiBZKx7MnpbEhh9jyipgxe19OcubqV5w
April 1, 2024
79059
Bangladesh
BGD
true
2
1
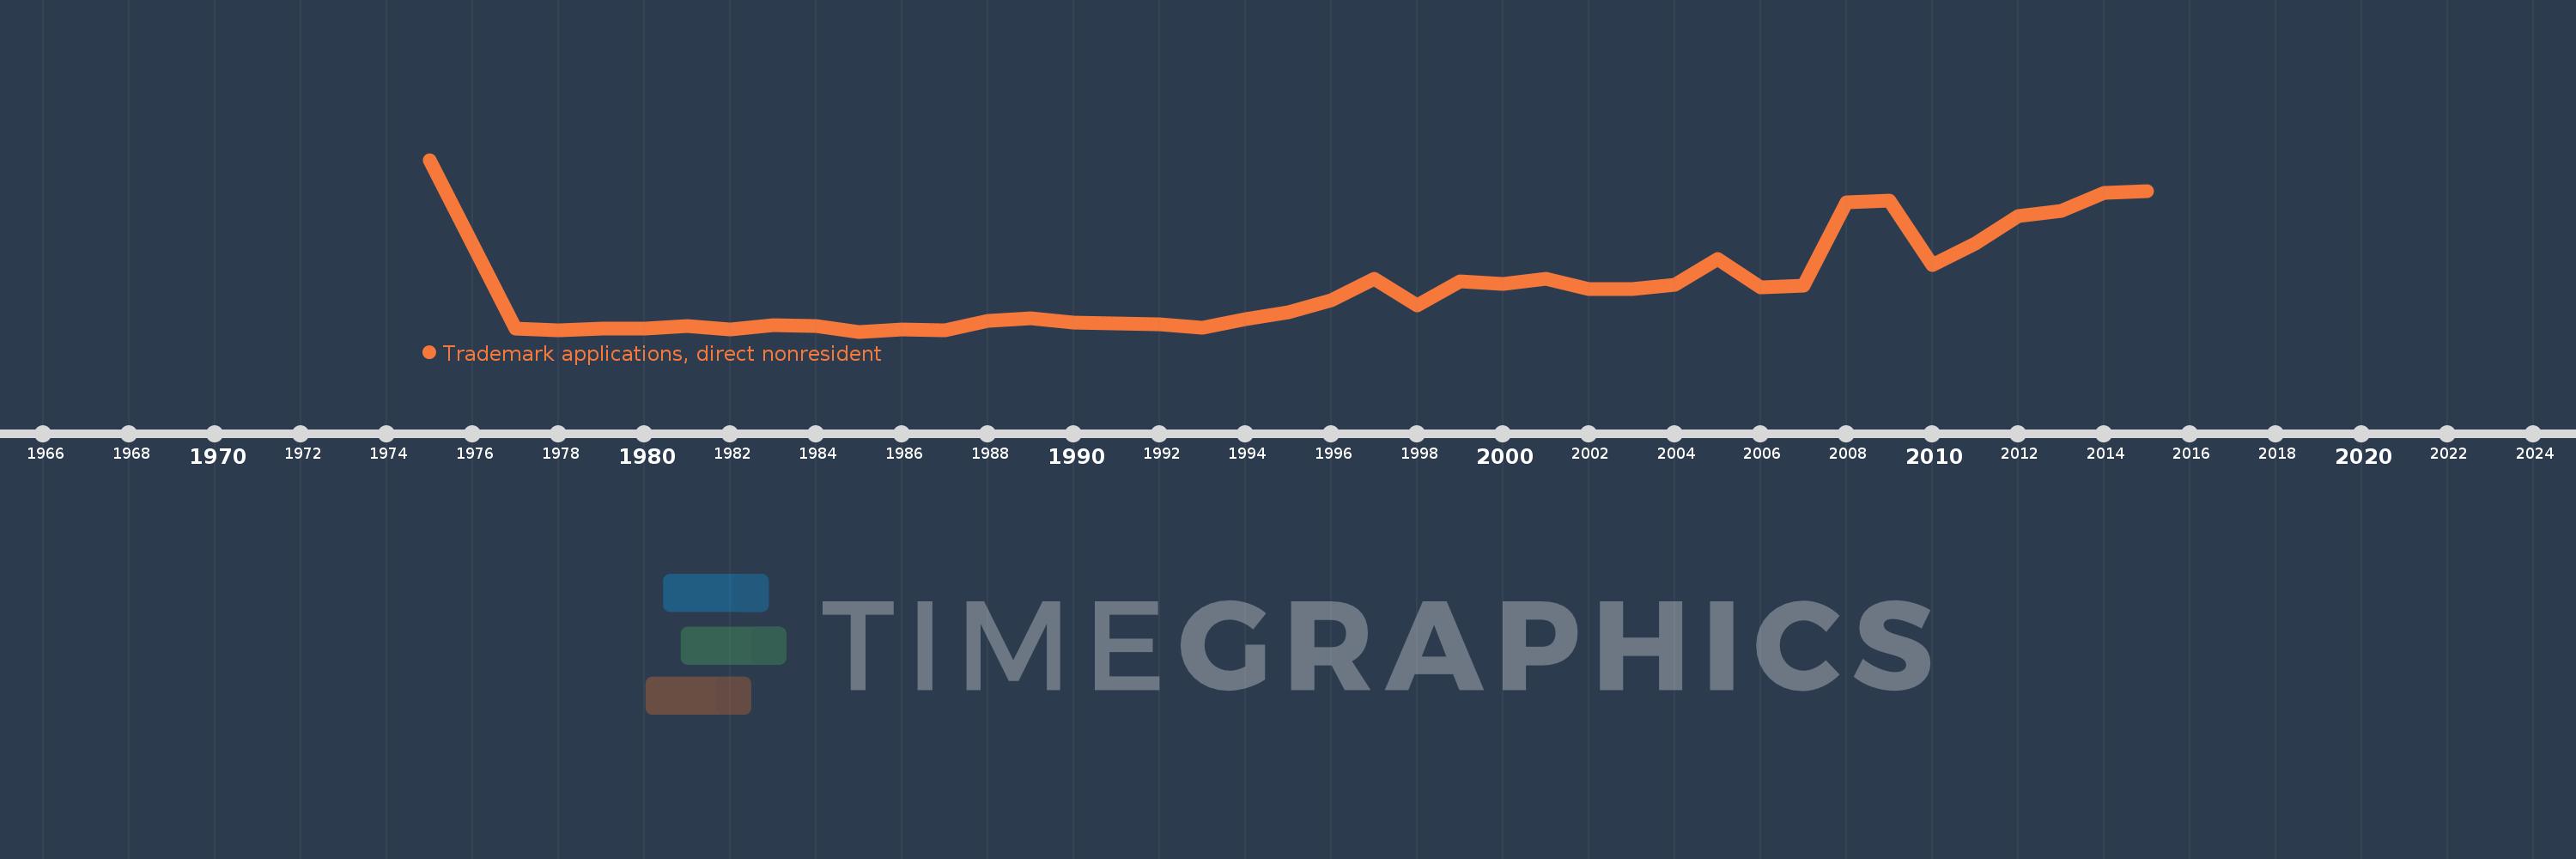
Trademark applications, direct nonresident
2015,2014,2013,2012,2011,2010,2009,2008,2007,2006,2005,2004,2003,2002,2001,2000,1999,1998,1997,1996,1995,1994,1993,1992,1991,1990,1989,1988,1987,1986,1985,1984,1983,1982,1981,1980,1979,1978,1977,1975
Estas estadísticas en otros países:
AlbaniaAlgeriaAndorraAngolaAntigua and BarbudaArab WorldArgentinaArmeniaArubaAustraliaAustriaAzerbaijanBahamas, TheBahrainBangladeshBarbadosBelarusBelgiumBelizeBhutanBoliviaBosnia and HerzegovinaBotswanaBrazilBrunei DarussalamBulgariaBurundiCambodiaCanadaCaribbean small statesCentral Europe and the BalticsChileChinaColombiaCongo, Dem. Rep.Costa RicaCroatiaCubaCuracaoCyprusCzech RepublicDenmarkDjiboutiDominicaDominican RepublicEarly-demographic dividendEast Asia & PacificEast Asia & Pacific (excluding high income)East Asia & Pacific (IDA & IBRD countries)EcuadorEgypt, Arab Rep.El SalvadorEstoniaEthiopiaEuro areaEurope & Central AsiaEurope & Central Asia (excluding high income)Europe & Central Asia (IDA & IBRD countries)European UnionFijiFinlandFranceGambia, TheGeorgiaGermanyGhanaGreeceGrenadaGuatemalaGuyanaHaitiHigh incomeHondurasHong Kong SAR, ChinaHungaryIBRD onlyIcelandIDA & IBRD totalIDA blendIndiaIndonesiaIran, Islamic Rep.IraqIrelandIsraelItalyJamaicaJapanJordanKazakhstanKenyaKiribatiKorea, Dem. People’s Rep.Korea, Rep.KuwaitKyrgyz RepublicLao PDRLate-demographic dividendLatin America & Caribbean Latin America & Caribbean (excluding high income)Latin America & the Caribbean (IDA & IBRD countries)LatviaLebanonLesothoLiberiaLibyaLiechtensteinLithuaniaLow & middle incomeLower middle incomeLuxembourgMacao SAR, ChinaMacedonia, FYRMadagascarMalawiMalaysiaMaliMaltaMauritiusMexicoMiddle East & North AfricaMiddle East & North Africa (excluding high income)Middle East & North Africa (IDA & IBRD countries)Middle incomeMoldovaMonacoMongoliaMontenegroMoroccoMozambiqueMyanmarNamibiaNepalNetherlandsNew ZealandNicaraguaNigeriaNorth AmericaNorwayOECD membersOmanOther small statesPacific island small statesPakistanPanamaPapua New GuineaParaguayPeruPhilippinesPolandPortugalPost-demographic dividendQatarRomaniaRussian FederationRwandaSamoaSan MarinoSao Tome and PrincipeSaudi ArabiaSerbiaSeychellesSierra LeoneSingaporeSint Maarten (Dutch part)Slovak RepublicSloveniaSmall statesSolomon IslandsSomaliaSouth AfricaSouth AsiaSouth Asia (IDA & IBRD)SpainSri LankaSt. LuciaSt. Vincent and the GrenadinesSudanSurinameSwazilandSwedenSwitzerlandSyrian Arab RepublicTajikistanTanzaniaThailandTongaTrinidad and TobagoTunisiaTurkeyTurkmenistanTuvaluUgandaUkraineUnited Arab EmiratesUnited KingdomUnited StatesUpper middle incomeUruguayUzbekistanVenezuela, RBVietnamWorldYemen, Rep.ZambiaZimbabwe línea de tiempo (timeline):
En esta escala de tiempo se presenta un gráfico de 1975 y 2015 de Bangladesh. Los datos de 1974 están ausentes. El número de observaciones reales por fecha: 40.
Fuente (nombre):
Indicadores del desarrollo mundial
Fuente (organización):
World Intellectual Property Organization (WIPO), WIPO Patent Report: Statistics on Worldwide Patent Activity. The International Bureau of WIPO assumes no responsibility with respect to the transformation of these data.
Categorías:
Science & Technology
Se ha actualizado:
23 abr 2017 año
Los indicadores de los cambios de valor en los últimos años
Mínimo:
272.0
1 ene 1985 año
Máximo:
4.359 mil
1 ene 1975 año
A la fecha de observación
Valor
Cambio absoluto
El cambio con respecto al valor anterior
1 ene 1975 año
4.359 mil
+4.359 mil
0.0%
1 ene 1977 año
335.0
-4.024 mil
-92.31%
1 ene 1978 año
302.0
-33.0
-9.85%
1 ene 1979 año
349.0
+47.0
15.56%
1 ene 1980 año
350.0
+1.0
0.29%
1 ene 1981 año
412.0
+62.0
17.71%
1 ene 1982 año
326.0
-86.0
-20.87%
1 ene 1983 año
417.0
+91.0
27.91%
1 ene 1984 año
410.0
-7.0
-1.68%
1 ene 1985 año
272.0
-138.0
-33.66%
1 ene 1986 año
317.0
+45.0
16.54%
1 ene 1987 año
299.0
-18.0
-5.68%
1 ene 1988 año
521.0
+222.0
74.25%
1 ene 1989 año
593.0
+72.0
13.82%
1 ene 1990 año
492.0
-101.0
-17.03%
1 ene 1991 año
466.0
-26.0
-5.28%
1 ene 1992 año
436.0
-30.0
-6.44%
1 ene 1993 año
368.0
-68.0
-15.6%
1 ene 1994 año
577.0
+209.0
56.79%
1 ene 1995 año
735.0
+158.0
27.38%
1 ene 1996 año
1.015 mil
+280.0
38.1%
1 ene 1997 año
1.529 mil
+514.0
50.64%
1 ene 1998 año
891.0
-638.0
-41.73%
1 ene 1999 año
1.458 mil
+567.0
63.64%
1 ene 2000 año
1.408 mil
-50.0
-3.43%
1 ene 2001 año
1.531 mil
+123.0
8.74%
1 ene 2002 año
1.287 mil
-244.0
-15.94%
1 ene 2003 año
1.277 mil
-10.0
-0.78%
1 ene 2004 año
1.381 mil
+104.0
8.14%
1 ene 2005 año
1.992 mil
+611.0
44.24%
1 ene 2006 año
1.332 mil
-660.0
-33.13%
1 ene 2007 año
1.374 mil
+42.0
3.15%
1 ene 2008 año
3.341 mil
+1.967 mil
143.16%
1 ene 2009 año
3.388 mil
+47.0
1.41%
1 ene 2010 año
1.859 mil
-1.529 mil
-45.13%
1 ene 2011 año
2.374 mil
+515.0
27.7%
1 ene 2012 año
3.013 mil
+639.0
26.92%
1 ene 2013 año
3.135 mil
+122.0
4.05%
1 ene 2014 año
3.58 mil
+445.0
14.19%
1 ene 2015 año
3.611 mil
+31.0
0.87%
Ranking de los países por los datos estadísticos actuales


Comentarios: