29
/es/
es
AIzaSyAYiBZKx7MnpbEhh9jyipgxe19OcubqV5w
April 1, 2024
225491
Poland
POL
true
2
1
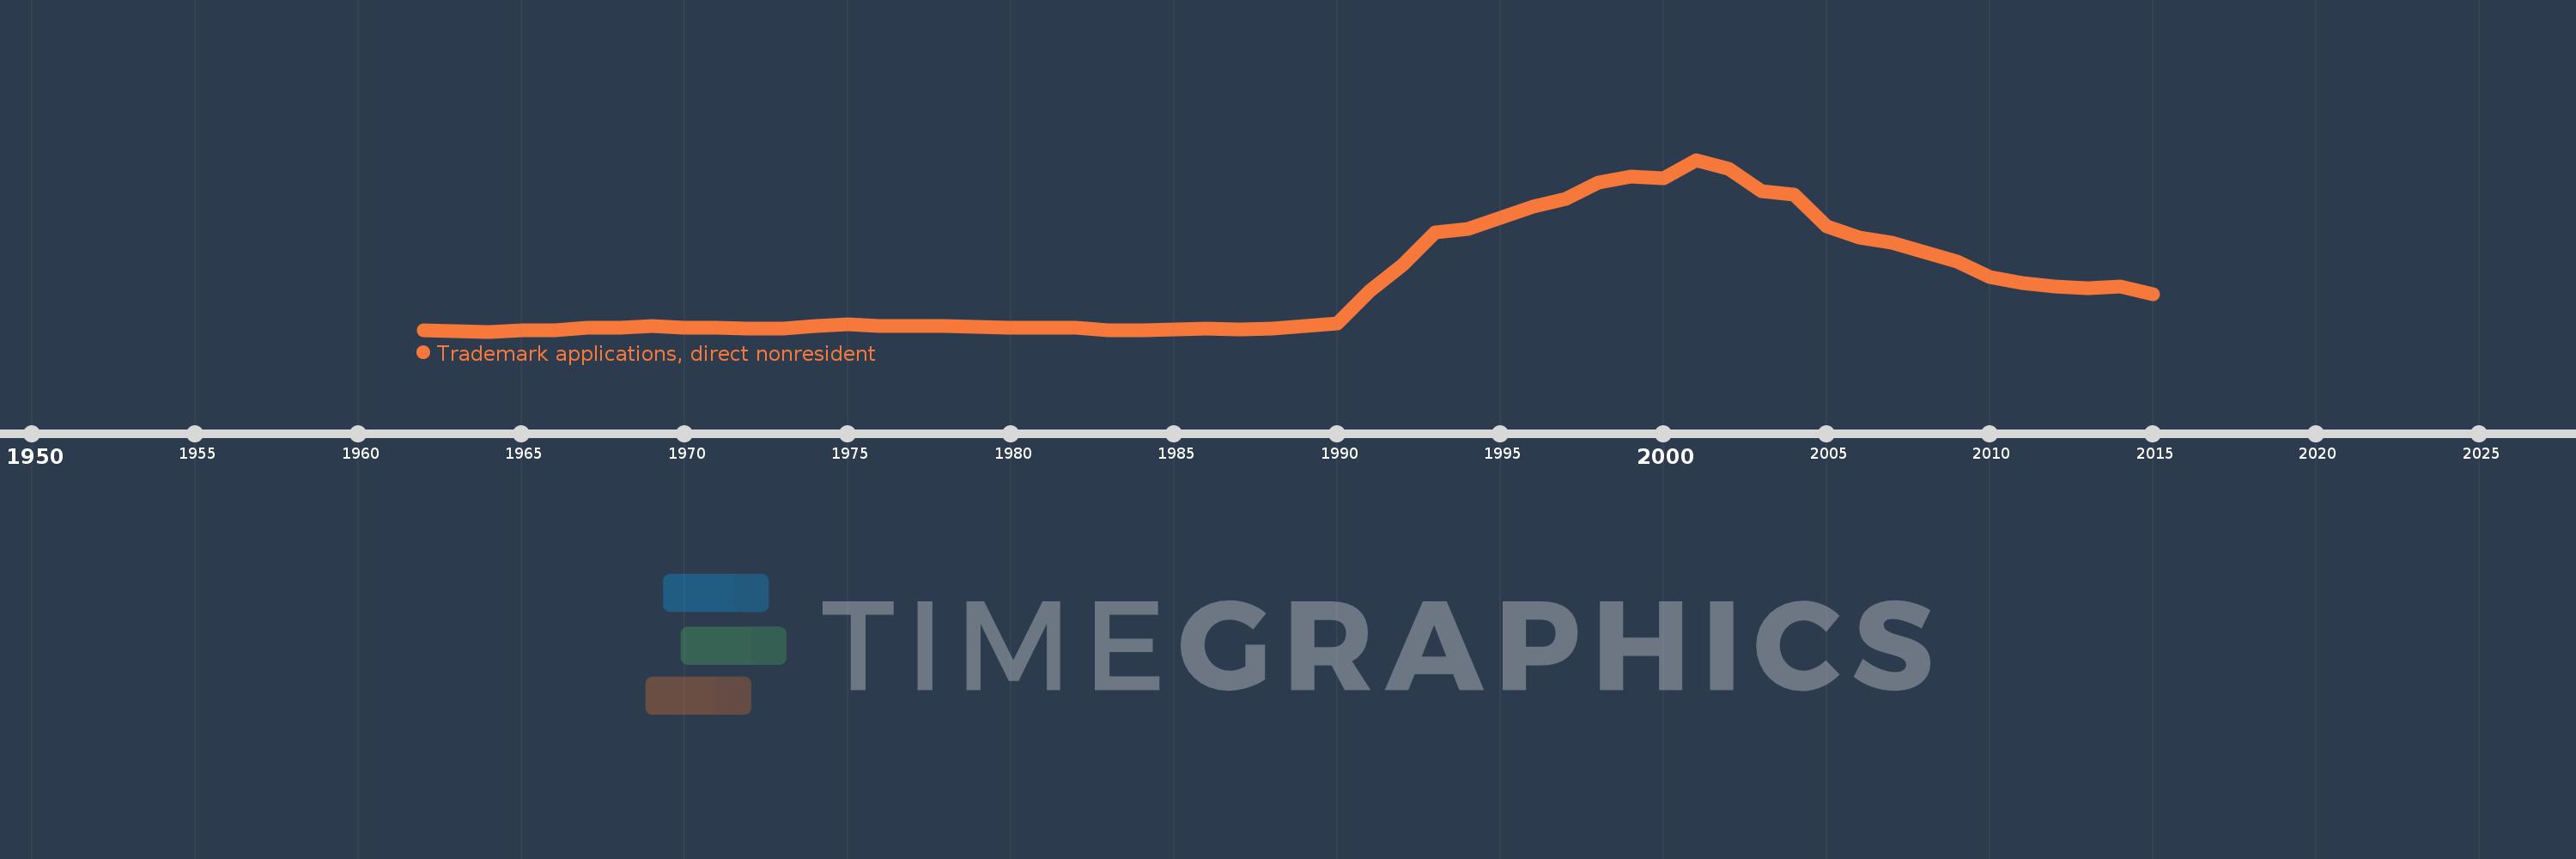
Trademark applications, direct nonresident
2015,2014,2013,2012,2011,2010,2009,2008,2007,2006,2005,2004,2003,2002,2001,2000,1999,1998,1997,1996,1995,1994,1993,1992,1991,1990,1989,1988,1987,1986,1985,1984,1983,1982,1981,1980,1979,1978,1977,1976,1975,1974,1973,1972,1971,1970,1969,1968,1967,1966,1965,1964,1963,1962
Estas estadísticas en otros países:
AlbaniaAlgeriaAndorraAngolaAntigua and BarbudaArab WorldArgentinaArmeniaArubaAustraliaAustriaAzerbaijanBahamas, TheBahrainBangladeshBarbadosBelarusBelgiumBelizeBhutanBoliviaBosnia and HerzegovinaBotswanaBrazilBrunei DarussalamBulgariaBurundiCambodiaCanadaCaribbean small statesCentral Europe and the BalticsChileChinaColombiaCongo, Dem. Rep.Costa RicaCroatiaCubaCuracaoCyprusCzech RepublicDenmarkDjiboutiDominicaDominican RepublicEarly-demographic dividendEast Asia & PacificEast Asia & Pacific (excluding high income)East Asia & Pacific (IDA & IBRD countries)EcuadorEgypt, Arab Rep.El SalvadorEstoniaEthiopiaEuro areaEurope & Central AsiaEurope & Central Asia (excluding high income)Europe & Central Asia (IDA & IBRD countries)European UnionFijiFinlandFranceGambia, TheGeorgiaGermanyGhanaGreeceGrenadaGuatemalaGuyanaHaitiHigh incomeHondurasHong Kong SAR, ChinaHungaryIBRD onlyIcelandIDA & IBRD totalIDA blendIndiaIndonesiaIran, Islamic Rep.IraqIrelandIsraelItalyJamaicaJapanJordanKazakhstanKenyaKiribatiKorea, Dem. People’s Rep.Korea, Rep.KuwaitKyrgyz RepublicLao PDRLate-demographic dividendLatin America & Caribbean Latin America & Caribbean (excluding high income)Latin America & the Caribbean (IDA & IBRD countries)LatviaLebanonLesothoLiberiaLibyaLiechtensteinLithuaniaLow & middle incomeLower middle incomeLuxembourgMacao SAR, ChinaMacedonia, FYRMadagascarMalawiMalaysiaMaliMaltaMauritiusMexicoMiddle East & North AfricaMiddle East & North Africa (excluding high income)Middle East & North Africa (IDA & IBRD countries)Middle incomeMoldovaMonacoMongoliaMontenegroMoroccoMozambiqueMyanmarNamibiaNepalNetherlandsNew ZealandNicaraguaNigeriaNorth AmericaNorwayOECD membersOmanOther small statesPacific island small statesPakistanPanamaPapua New GuineaParaguayPeruPhilippinesPolandPortugalPost-demographic dividendQatarRomaniaRussian FederationRwandaSamoaSan MarinoSao Tome and PrincipeSaudi ArabiaSerbiaSeychellesSierra LeoneSingaporeSint Maarten (Dutch part)Slovak RepublicSloveniaSmall statesSolomon IslandsSomaliaSouth AfricaSouth AsiaSouth Asia (IDA & IBRD)SpainSri LankaSt. LuciaSt. Vincent and the GrenadinesSudanSurinameSwazilandSwedenSwitzerlandSyrian Arab RepublicTajikistanTanzaniaThailandTongaTrinidad and TobagoTunisiaTurkeyTurkmenistanTuvaluUgandaUkraineUnited Arab EmiratesUnited KingdomUnited StatesUpper middle incomeUruguayUzbekistanVenezuela, RBVietnamWorldYemen, Rep.ZambiaZimbabwe línea de tiempo (timeline):
En esta escala de tiempo se presenta un gráfico de 1962 y 2015 de Poland. Los datos de 1961 están ausentes. El número de observaciones reales por fecha: 54.
Fuente (nombre):
Indicadores del desarrollo mundial
Fuente (organización):
World Intellectual Property Organization (WIPO), WIPO Patent Report: Statistics on Worldwide Patent Activity. The International Bureau of WIPO assumes no responsibility with respect to the transformation of these data.
Categorías:
Science & Technology
Se ha actualizado:
23 abr 2017 año
Los indicadores de los cambios de valor en los últimos años
Mínimo:
288.0
1 ene 1964 año
Máximo:
14.096 mil
1 ene 2001 año
A la fecha de observación
Valor
Cambio absoluto
El cambio con respecto al valor anterior
1 ene 1962 año
388.0
+388.0
0.0%
1 ene 1963 año
317.0
-71.0
-18.3%
1 ene 1964 año
288.0
-29.0
-9.15%
1 ene 1965 año
384.0
+96.0
33.33%
1 ene 1966 año
394.0
+10.0
2.6%
1 ene 1967 año
575.0
+181.0
45.94%
1 ene 1968 año
571.0
-4.0
-0.7%
1 ene 1969 año
728.0
+157.0
27.5%
1 ene 1970 año
591.0
-137.0
-18.82%
1 ene 1971 año
632.0
+41.0
6.94%
1 ene 1972 año
546.0
-86.0
-13.61%
1 ene 1973 año
554.0
+8.0
1.47%
1 ene 1974 año
732.0
+178.0
32.13%
1 ene 1975 año
851.0
+119.0
16.26%
1 ene 1976 año
763.0
-88.0
-10.34%
1 ene 1977 año
758.0
-5.0
-0.66%
1 ene 1978 año
720.0
-38.0
-5.01%
1 ene 1979 año
679.0
-41.0
-5.69%
1 ene 1980 año
617.0
-62.0
-9.13%
1 ene 1981 año
579.0
-38.0
-6.16%
1 ene 1982 año
591.0
+12.0
2.07%
1 ene 1983 año
413.0
-178.0
-30.12%
1 ene 1984 año
402.0
-11.0
-2.66%
1 ene 1985 año
443.0
+41.0
10.2%
1 ene 1986 año
540.0
+97.0
21.9%
1 ene 1987 año
451.0
-89.0
-16.48%
1 ene 1988 año
524.0
+73.0
16.19%
1 ene 1989 año
770.0
+246.0
46.95%
1 ene 1990 año
969.0
+199.0
25.84%
1 ene 1991 año
3.547 mil
+2.578 mil
266.05%
1 ene 1992 año
5.624 mil
+2.077 mil
58.56%
1 ene 1993 año
8.27 mil
+2.646 mil
47.05%
1 ene 1994 año
8.535 mil
+265.0
3.2%
1 ene 1995 año
9.444 mil
+909.0
10.65%
1 ene 1996 año
10.357 mil
+913.0
9.67%
1 ene 1997 año
10.959 mil
+602.0
5.81%
1 ene 1998 año
12.296 mil
+1.337 mil
12.2%
1 ene 1999 año
12.719 mil
+423.0
3.44%
1 ene 2000 año
12.595 mil
-124.0
-0.97%
1 ene 2001 año
14.096 mil
+1.501 mil
11.92%
1 ene 2002 año
13.358 mil
-738.0
-5.24%
1 ene 2003 año
11.607 mil
-1.751 mil
-13.11%
1 ene 2004 año
11.33 mil
-277.0
-2.39%
1 ene 2005 año
8.76 mil
-2.57 mil
-22.68%
1 ene 2006 año
7.826 mil
-934.0
-10.66%
1 ene 2007 año
7.419 mil
-407.0
-5.2%
1 ene 2008 año
6.663 mil
-756.0
-10.19%
1 ene 2009 año
5.904 mil
-759.0
-11.39%
1 ene 2010 año
4.648 mil
-1.256 mil
-21.27%
1 ene 2011 año
4.187 mil
-461.0
-9.92%
1 ene 2012 año
3.943 mil
-244.0
-5.83%
1 ene 2013 año
3.777 mil
-166.0
-4.21%
1 ene 2014 año
3.944 mil
+167.0
4.42%
1 ene 2015 año
3.275 mil
-669.0
-16.96%
Ranking de los países por los datos estadísticos actuales


Comentarios: