29
/es/
es
AIzaSyAYiBZKx7MnpbEhh9jyipgxe19OcubqV5w
April 1, 2024
78288
Bangladesh
BGD
true
2
1
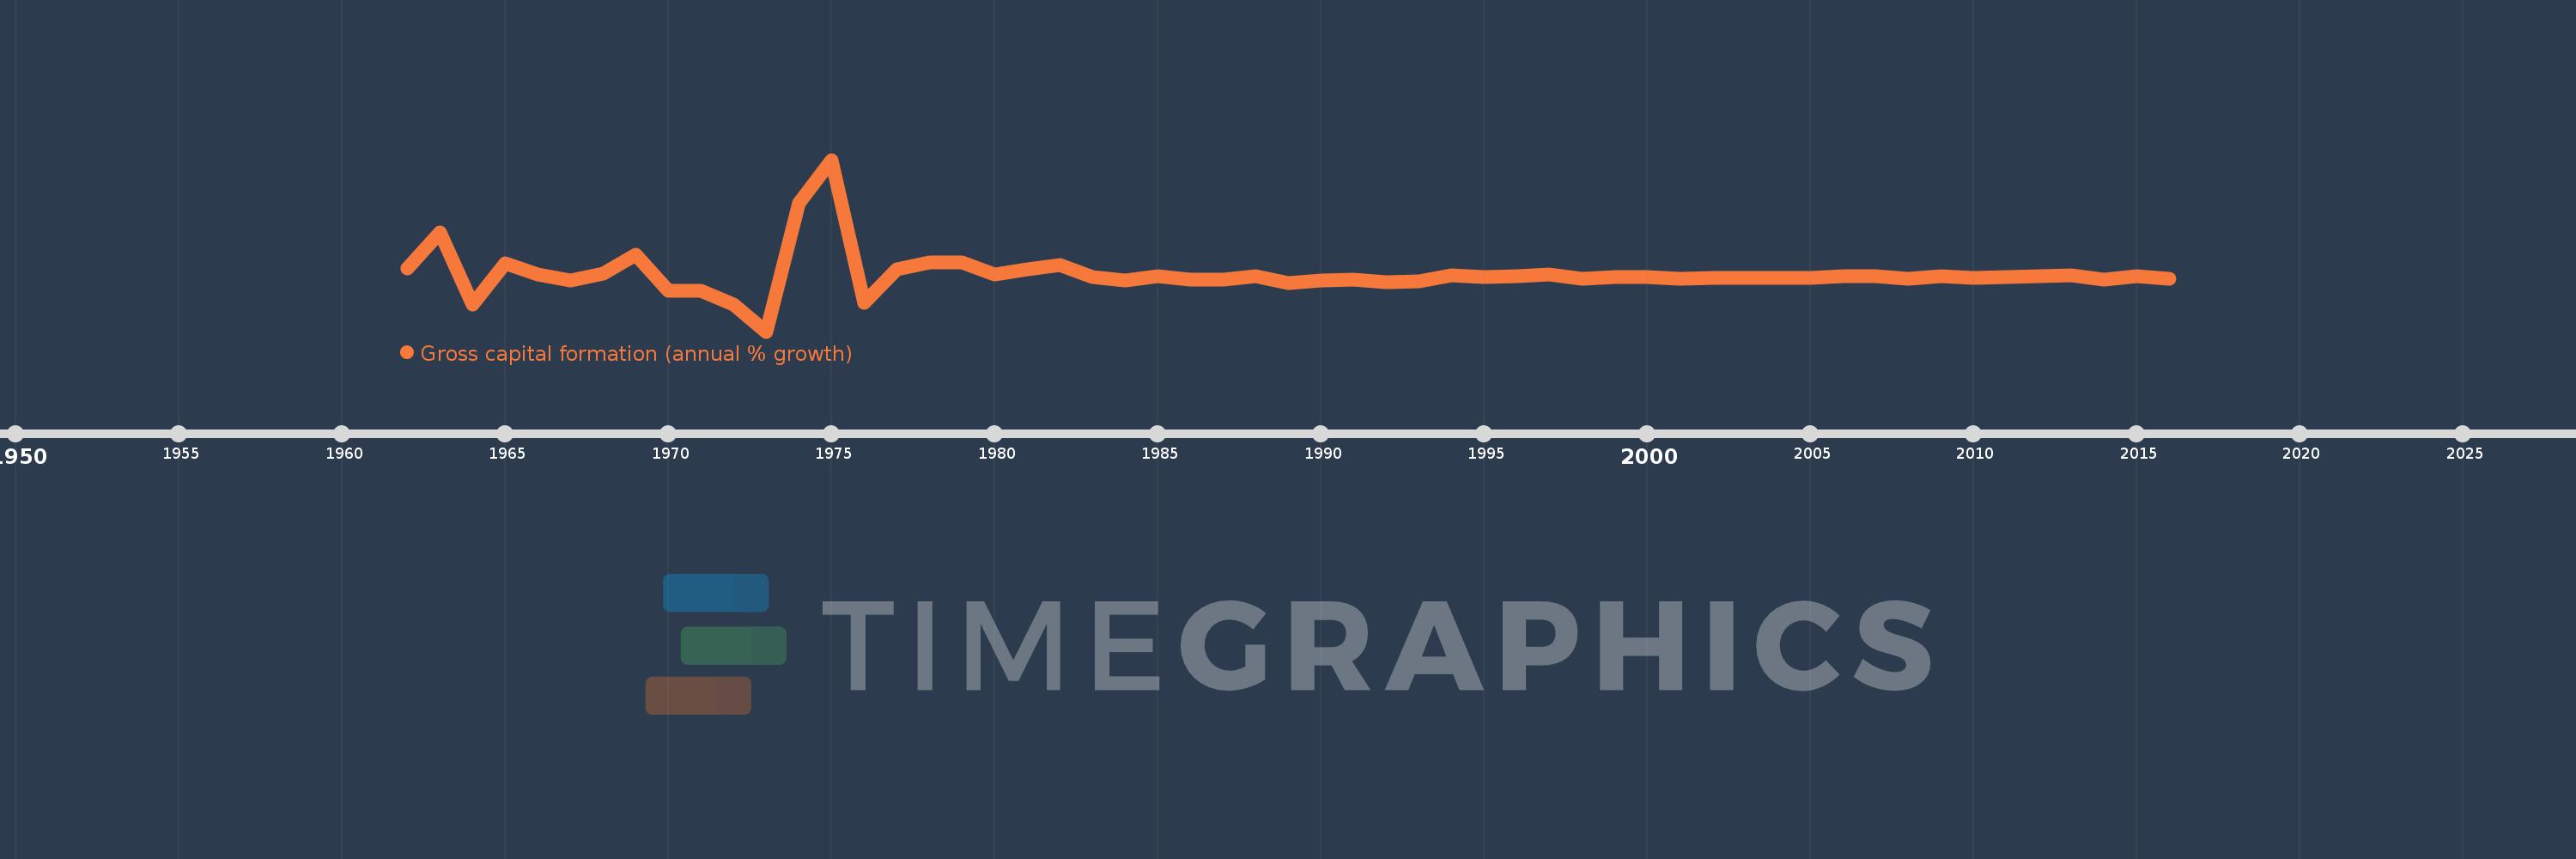
Gross capital formation (annual % growth)
2016,2015,2014,2013,2012,2011,2010,2009,2008,2007,2006,2005,2004,2003,2002,2001,2000,1999,1998,1997,1996,1995,1994,1993,1992,1991,1990,1989,1988,1987,1986,1985,1984,1983,1982,1981,1980,1979,1978,1977,1976,1975,1974,1973,1972,1971,1970,1969,1968,1967,1966,1965,1964,1963,1962
Estas estadísticas en otros países:
AlbaniaAlgeriaAntigua and BarbudaArab WorldArgentinaArmeniaAustraliaAustriaAzerbaijanBahamas, TheBahrainBangladeshBarbadosBelarusBelgiumBelizeBeninBhutanBoliviaBosnia and HerzegovinaBotswanaBrazilBrunei DarussalamBulgariaBurkina FasoBurundiCabo VerdeCambodiaCameroonCanadaCaribbean small statesCentral Europe and the BalticsChadChileChinaColombiaComorosCongo, Dem. Rep.Congo, Rep.Costa RicaCote d'IvoireCroatiaCubaCyprusCzech RepublicDenmarkDjiboutiDominican RepublicEarly-demographic dividendEast Asia & PacificEast Asia & Pacific (excluding high income)East Asia & Pacific (IDA & IBRD countries)EcuadorEgypt, Arab Rep.El SalvadorEquatorial GuineaEritreaEstoniaEthiopiaEuro areaEurope & Central AsiaEurope & Central Asia (excluding high income)Europe & Central Asia (IDA & IBRD countries)European UnionFijiFinlandFranceGabonGambia, TheGeorgiaGermanyGhanaGreeceGuatemalaGuineaGuinea-BissauHaitiHeavily indebted poor countries (HIPC)High incomeHondurasHong Kong SAR, ChinaHungaryIBRD onlyIcelandIDA & IBRD totalIDA blendIDA onlyIDA totalIndiaIndonesiaIran, Islamic Rep.IrelandIsraelItalyJamaicaJapanJordanKazakhstanKenyaKorea, Rep.KosovoKuwaitKyrgyz RepublicLao PDRLate-demographic dividendLatin America & Caribbean Latin America & Caribbean (excluding high income)Latin America & the Caribbean (IDA & IBRD countries)LatviaLeast developed countries: UN classificationLebanonLiberiaLithuaniaLow & middle incomeLow incomeLower middle incomeLuxembourgMacao SAR, ChinaMacedonia, FYRMadagascarMalawiMalaysiaMaliMaltaMauritaniaMauritiusMexicoMiddle East & North AfricaMiddle East & North Africa (excluding high income)Middle East & North Africa (IDA & IBRD countries)Middle incomeMoldovaMongoliaMontenegroMoroccoMozambiqueNamibiaNepalNetherlandsNew ZealandNicaraguaNigerNigeriaNorth AmericaNorwayOECD membersOmanOther small statesPakistanPanamaPapua New GuineaParaguayPeruPhilippinesPolandPortugalPost-demographic dividendPre-demographic dividendPuerto RicoQatarRomaniaRussian FederationRwandaSaudi ArabiaSenegalSerbiaSeychellesSierra LeoneSingaporeSlovak RepublicSloveniaSmall statesSomaliaSouth AfricaSouth AsiaSouth Asia (IDA & IBRD)South SudanSpainSri LankaSub-Saharan Africa Sub-Saharan Africa (excluding high income)Sub-Saharan Africa (IDA & IBRD countries)SudanSurinameSwazilandSwedenSwitzerlandSyrian Arab RepublicTajikistanTanzaniaThailandTimor-LesteTogoTrinidad and TobagoTunisiaTurkeyTurkmenistanUgandaUkraineUnited Arab EmiratesUnited KingdomUnited StatesUpper middle incomeUruguayUzbekistanVanuatuVenezuela, RBVietnamWest Bank and GazaWorldZimbabwe línea de tiempo (timeline):
En esta escala de tiempo se presenta un gráfico de 1962 y 2016 de Bangladesh. Los datos de 1961 están ausentes. El número de observaciones reales por fecha: 55.
Fuente (nombre):
Indicadores del desarrollo mundial
Fuente (organización):
World Bank national accounts data, and OECD National Accounts data files.
Categorías:
Economy & Growth
Se ha actualizado:
23 abr 2017 año
Los indicadores de los cambios de valor en los últimos años
Mínimo:
-55.643
1 ene 1973 año
Máximo:
147.332
1 ene 1975 año
A la fecha de observación
Valor
Cambio absoluto
El cambio con respecto al valor anterior
1 ene 1962 año
18.765
+18.765
0.0%
1 ene 1963 año
61.889
+43.124
229.81%
1 ene 1964 año
-23.493
-85.382
-137.96%
1 ene 1965 año
25.298
+48.791
-207.68%
1 ene 1966 año
11.853
-13.445
-53.15%
1 ene 1967 año
4.242
-7.611
-64.21%
1 ene 1968 año
12.885
+8.643
203.74%
1 ene 1969 año
34.924
+22.039
171.05%
1 ene 1970 año
-7.883
-42.807
-122.57%
1 ene 1971 año
-7.078
+0.805
-10.22%
1 ene 1972 año
-24.085
-17.007
240.28%
1 ene 1973 año
-55.643
-31.558
131.03%
1 ene 1974 año
96.481
+152.124
-273.39%
1 ene 1975 año
147.332
+50.851
52.71%
1 ene 1976 año
-22.089
-169.421
-114.99%
1 ene 1977 año
18.251
+40.34
-182.63%
1 ene 1978 año
26.224
+7.973
43.69%
1 ene 1979 año
25.811
-0.414
-1.58%
1 ene 1980 año
11.379
-14.432
-55.92%
1 ene 1981 año
17.447
+6.069
53.33%
1 ene 1982 año
22.856
+5.409
31.0%
1 ene 1983 año
8.59
-14.266
-62.42%
1 ene 1984 año
4.512
-4.078
-47.47%
1 ene 1985 año
9.956
+5.444
120.65%
1 ene 1986 año
5.924
-4.032
-40.5%
1 ene 1987 año
5.614
-0.31
-5.23%
1 ene 1988 año
10.29
+4.676
83.3%
1 ene 1989 año
1.532
-8.758
-85.11%
1 ene 1990 año
4.926
+3.394
221.52%
1 ene 1991 año
5.515
+0.59
11.97%
1 ene 1992 año
2.459
-3.056
-55.41%
1 ene 1993 año
4.007
+1.548
62.96%
1 ene 1994 año
11.164
+7.157
178.58%
1 ene 1995 año
9.238
-1.926
-17.26%
1 ene 1996 año
9.608
+0.371
4.01%
1 ene 1997 año
11.952
+2.344
24.39%
1 ene 1998 año
6.459
-5.492
-45.95%
1 ene 1999 año
9.113
+2.654
41.08%
1 ene 2000 año
8.587
-0.527
-5.78%
1 ene 2001 año
7.118
-1.469
-17.11%
1 ene 2002 año
7.935
+0.817
11.48%
1 ene 2003 año
7.42
-0.515
-6.49%
1 ene 2004 año
7.657
+0.237
3.2%
1 ene 2005 año
8.209
+0.551
7.2%
1 ene 2006 año
9.764
+1.555
18.94%
1 ene 2007 año
9.888
+0.124
1.27%
1 ene 2008 año
7.147
-2.741
-27.72%
1 ene 2009 año
9.815
+2.668
37.33%
1 ene 2010 año
7.388
-2.427
-24.73%
1 ene 2011 año
8.565
+1.176
15.92%
1 ene 2012 año
9.561
+0.996
11.63%
1 ene 2013 año
10.568
+1.007
10.53%
1 ene 2014 año
5.365
-5.203
-49.24%
1 ene 2015 año
9.855
+4.49
83.7%
1 ene 2016 año
7.119
-2.736
-27.76%
Ranking de los países por los datos estadísticos actuales


Comentarios: