29
/es/
es
AIzaSyAYiBZKx7MnpbEhh9jyipgxe19OcubqV5w
April 1, 2024
194270
Mauritius
MUS
true
2
1
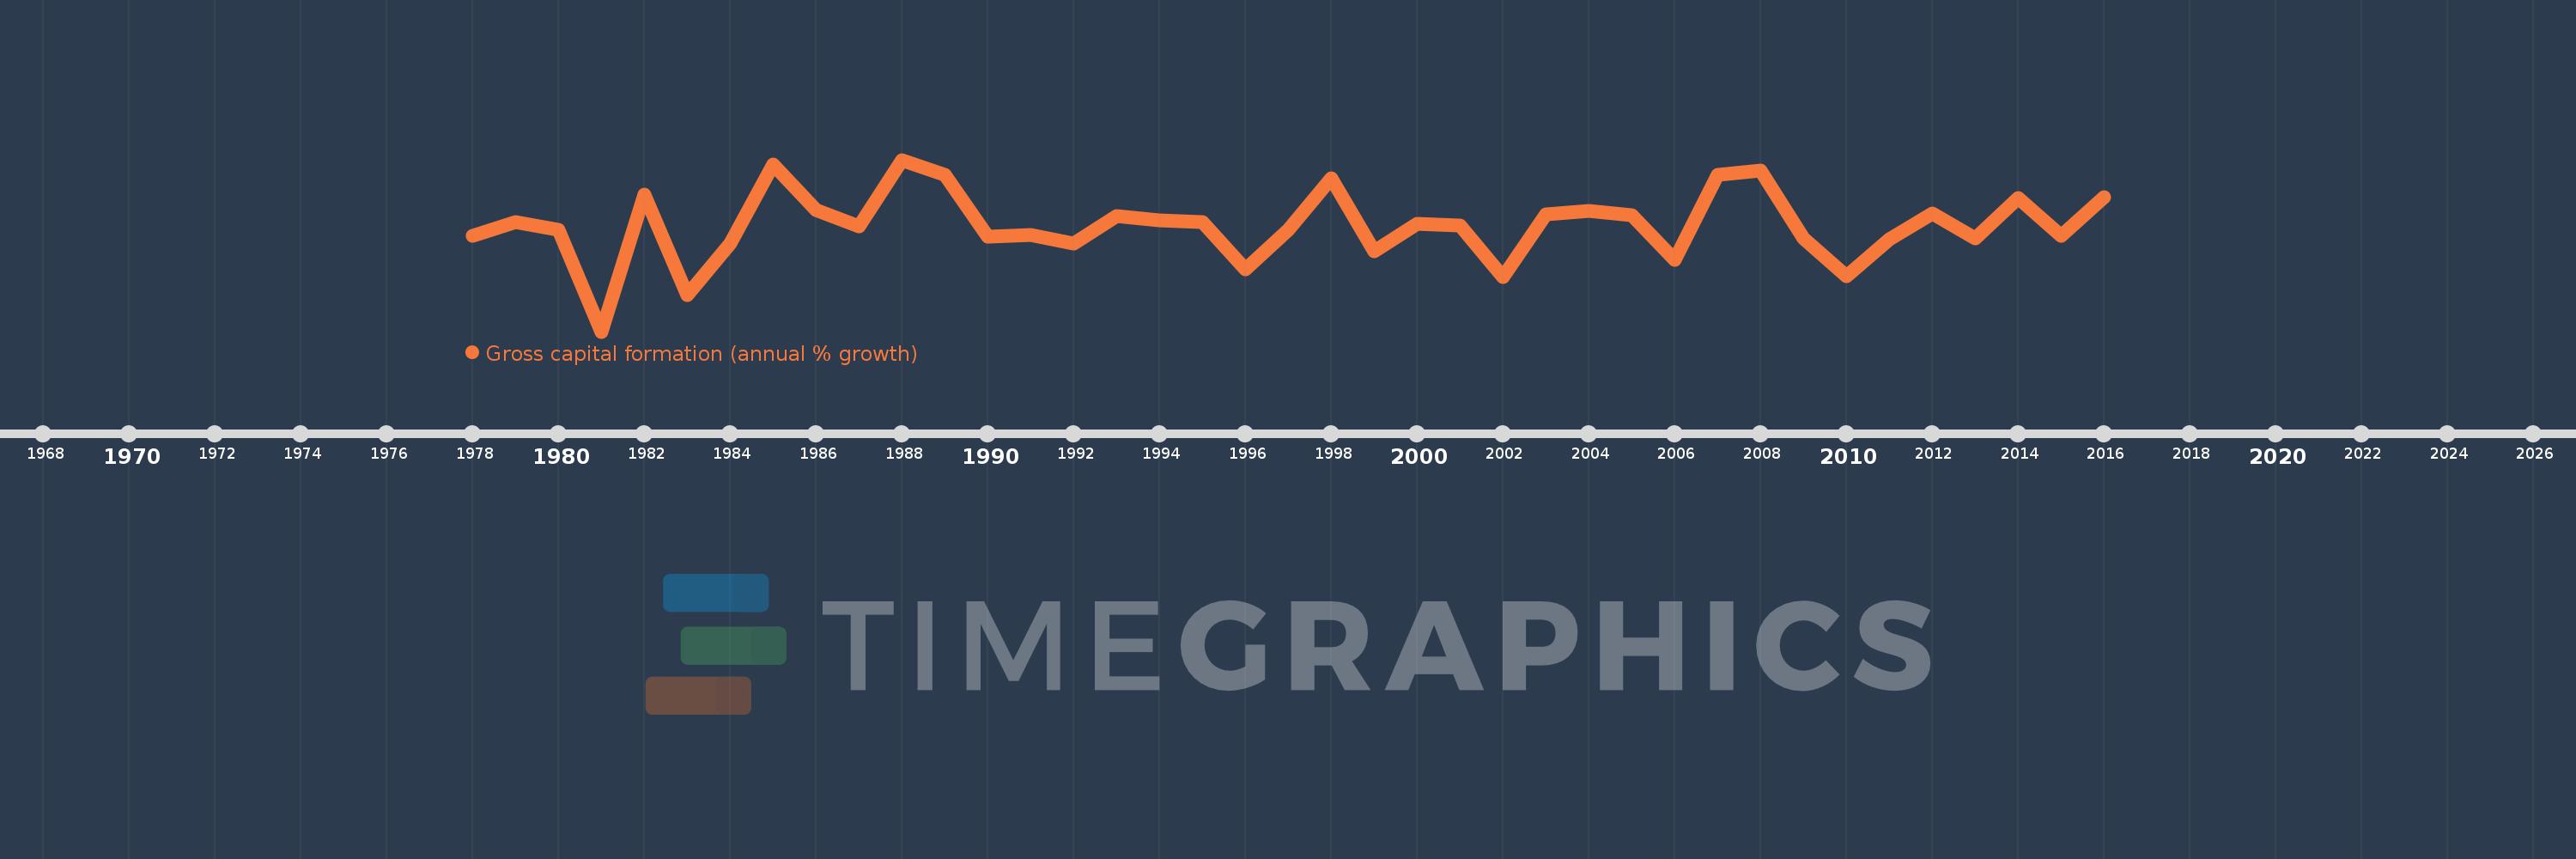
Gross capital formation (annual % growth)
2016,2015,2014,2013,2012,2011,2010,2009,2008,2007,2006,2005,2004,2003,2002,2001,2000,1999,1998,1997,1996,1995,1994,1993,1992,1991,1990,1989,1988,1987,1986,1985,1984,1983,1982,1981,1980,1979,1978
Estas estadísticas en otros países:
AlbaniaAlgeriaAntigua and BarbudaArab WorldArgentinaArmeniaAustraliaAustriaAzerbaijanBahamas, TheBahrainBangladeshBarbadosBelarusBelgiumBelizeBeninBhutanBoliviaBosnia and HerzegovinaBotswanaBrazilBrunei DarussalamBulgariaBurkina FasoBurundiCabo VerdeCambodiaCameroonCanadaCaribbean small statesCentral Europe and the BalticsChadChileChinaColombiaComorosCongo, Dem. Rep.Congo, Rep.Costa RicaCote d'IvoireCroatiaCubaCyprusCzech RepublicDenmarkDjiboutiDominican RepublicEarly-demographic dividendEast Asia & PacificEast Asia & Pacific (excluding high income)East Asia & Pacific (IDA & IBRD countries)EcuadorEgypt, Arab Rep.El SalvadorEquatorial GuineaEritreaEstoniaEthiopiaEuro areaEurope & Central AsiaEurope & Central Asia (excluding high income)Europe & Central Asia (IDA & IBRD countries)European UnionFijiFinlandFranceGabonGambia, TheGeorgiaGermanyGhanaGreeceGuatemalaGuineaGuinea-BissauHaitiHeavily indebted poor countries (HIPC)High incomeHondurasHong Kong SAR, ChinaHungaryIBRD onlyIcelandIDA & IBRD totalIDA blendIDA onlyIDA totalIndiaIndonesiaIran, Islamic Rep.IrelandIsraelItalyJamaicaJapanJordanKazakhstanKenyaKorea, Rep.KosovoKuwaitKyrgyz RepublicLao PDRLate-demographic dividendLatin America & Caribbean Latin America & Caribbean (excluding high income)Latin America & the Caribbean (IDA & IBRD countries)LatviaLeast developed countries: UN classificationLebanonLiberiaLithuaniaLow & middle incomeLow incomeLower middle incomeLuxembourgMacao SAR, ChinaMacedonia, FYRMadagascarMalawiMalaysiaMaliMaltaMauritaniaMauritiusMexicoMiddle East & North AfricaMiddle East & North Africa (excluding high income)Middle East & North Africa (IDA & IBRD countries)Middle incomeMoldovaMongoliaMontenegroMoroccoMozambiqueNamibiaNepalNetherlandsNew ZealandNicaraguaNigerNigeriaNorth AmericaNorwayOECD membersOmanOther small statesPakistanPanamaPapua New GuineaParaguayPeruPhilippinesPolandPortugalPost-demographic dividendPre-demographic dividendPuerto RicoQatarRomaniaRussian FederationRwandaSaudi ArabiaSenegalSerbiaSeychellesSierra LeoneSingaporeSlovak RepublicSloveniaSmall statesSomaliaSouth AfricaSouth AsiaSouth Asia (IDA & IBRD)South SudanSpainSri LankaSub-Saharan Africa Sub-Saharan Africa (excluding high income)Sub-Saharan Africa (IDA & IBRD countries)SudanSurinameSwazilandSwedenSwitzerlandSyrian Arab RepublicTajikistanTanzaniaThailandTimor-LesteTogoTrinidad and TobagoTunisiaTurkeyTurkmenistanUgandaUkraineUnited Arab EmiratesUnited KingdomUnited StatesUpper middle incomeUruguayUzbekistanVanuatuVenezuela, RBVietnamWest Bank and GazaWorldZimbabwe línea de tiempo (timeline):
En esta escala de tiempo se presenta un gráfico de 1978 y 2016 de Mauritius. Los datos de 1977 están ausentes. El número de observaciones reales por fecha: 39.
Fuente (nombre):
Indicadores del desarrollo mundial
Fuente (organización):
World Bank national accounts data, and OECD National Accounts data files.
Categorías:
Economy & Growth
Se ha actualizado:
23 abr 2017 año
Los indicadores de los cambios de valor en los últimos años
Mínimo:
-40.422
1 ene 1981 año
Máximo:
35.479
1 ene 1988 año
A la fecha de observación
Valor
Cambio absoluto
El cambio con respecto al valor anterior
1 ene 1978 año
2.062
+2.062
0.0%
1 ene 1979 año
7.992
+5.93
287.65%
1 ene 1980 año
4.649
-3.343
-41.83%
1 ene 1981 año
-40.422
-45.071
-969.42%
1 ene 1982 año
20.205
+60.627
-149.99%
1 ene 1983 año
-24.242
-44.447
-219.98%
1 ene 1984 año
-1.403
+22.838
-94.21%
1 ene 1985 año
33.574
+34.978
-2.49 mil%
1 ene 1986 año
13.464
-20.11
-59.9%
1 ene 1987 año
5.894
-7.571
-56.23%
1 ene 1988 año
35.479
+29.585
502.0%
1 ene 1989 año
28.798
-6.681
-18.83%
1 ene 1990 año
1.668
-27.13
-94.21%
1 ene 1991 año
2.099
+0.431
25.81%
1 ene 1992 año
-1.345
-3.444
-164.09%
1 ene 1993 año
10.528
+11.873
-882.81%
1 ene 1994 año
8.695
-1.834
-17.42%
1 ene 1995 año
7.903
-0.791
-9.1%
1 ene 1996 año
-12.918
-20.821
-263.45%
1 ene 1997 año
4.569
+17.487
-135.37%
1 ene 1998 año
27.203
+22.634
495.42%
1 ene 1999 año
-4.928
-32.131
-118.12%
1 ene 2000 año
7.233
+12.161
-246.76%
1 ene 2001 año
6.361
-0.872
-12.06%
1 ene 2002 año
-16.172
-22.533
-354.24%
1 ene 2003 año
11.209
+27.381
-169.31%
1 ene 2004 año
12.845
+1.636
14.6%
1 ene 2005 año
11.001
-1.844
-14.35%
1 ene 2006 año
-8.627
-19.628
-178.42%
1 ene 2007 año
28.941
+37.568
-435.47%
1 ene 2008 año
30.723
+1.782
6.16%
1 ene 2009 año
0.784
-29.939
-97.45%
1 ene 2010 año
-15.997
-16.782
-2.14 mil%
1 ene 2011 año
0.292
+16.29
-101.83%
1 ene 2012 año
11.63
+11.338
3.88 mil%
1 ene 2013 año
0.64
-10.99
-94.49%
1 ene 2014 año
18.624
+17.984
2.81 mil%
1 ene 2015 año
1.866
-16.758
-89.98%
1 ene 2016 año
18.843
+16.976
909.55%
Ranking de los países por los datos estadísticos actuales


Comentarios: