29
/es/
es
AIzaSyAYiBZKx7MnpbEhh9jyipgxe19OcubqV5w
April 1, 2024
78236
Bangladesh
BGD
true
2
1
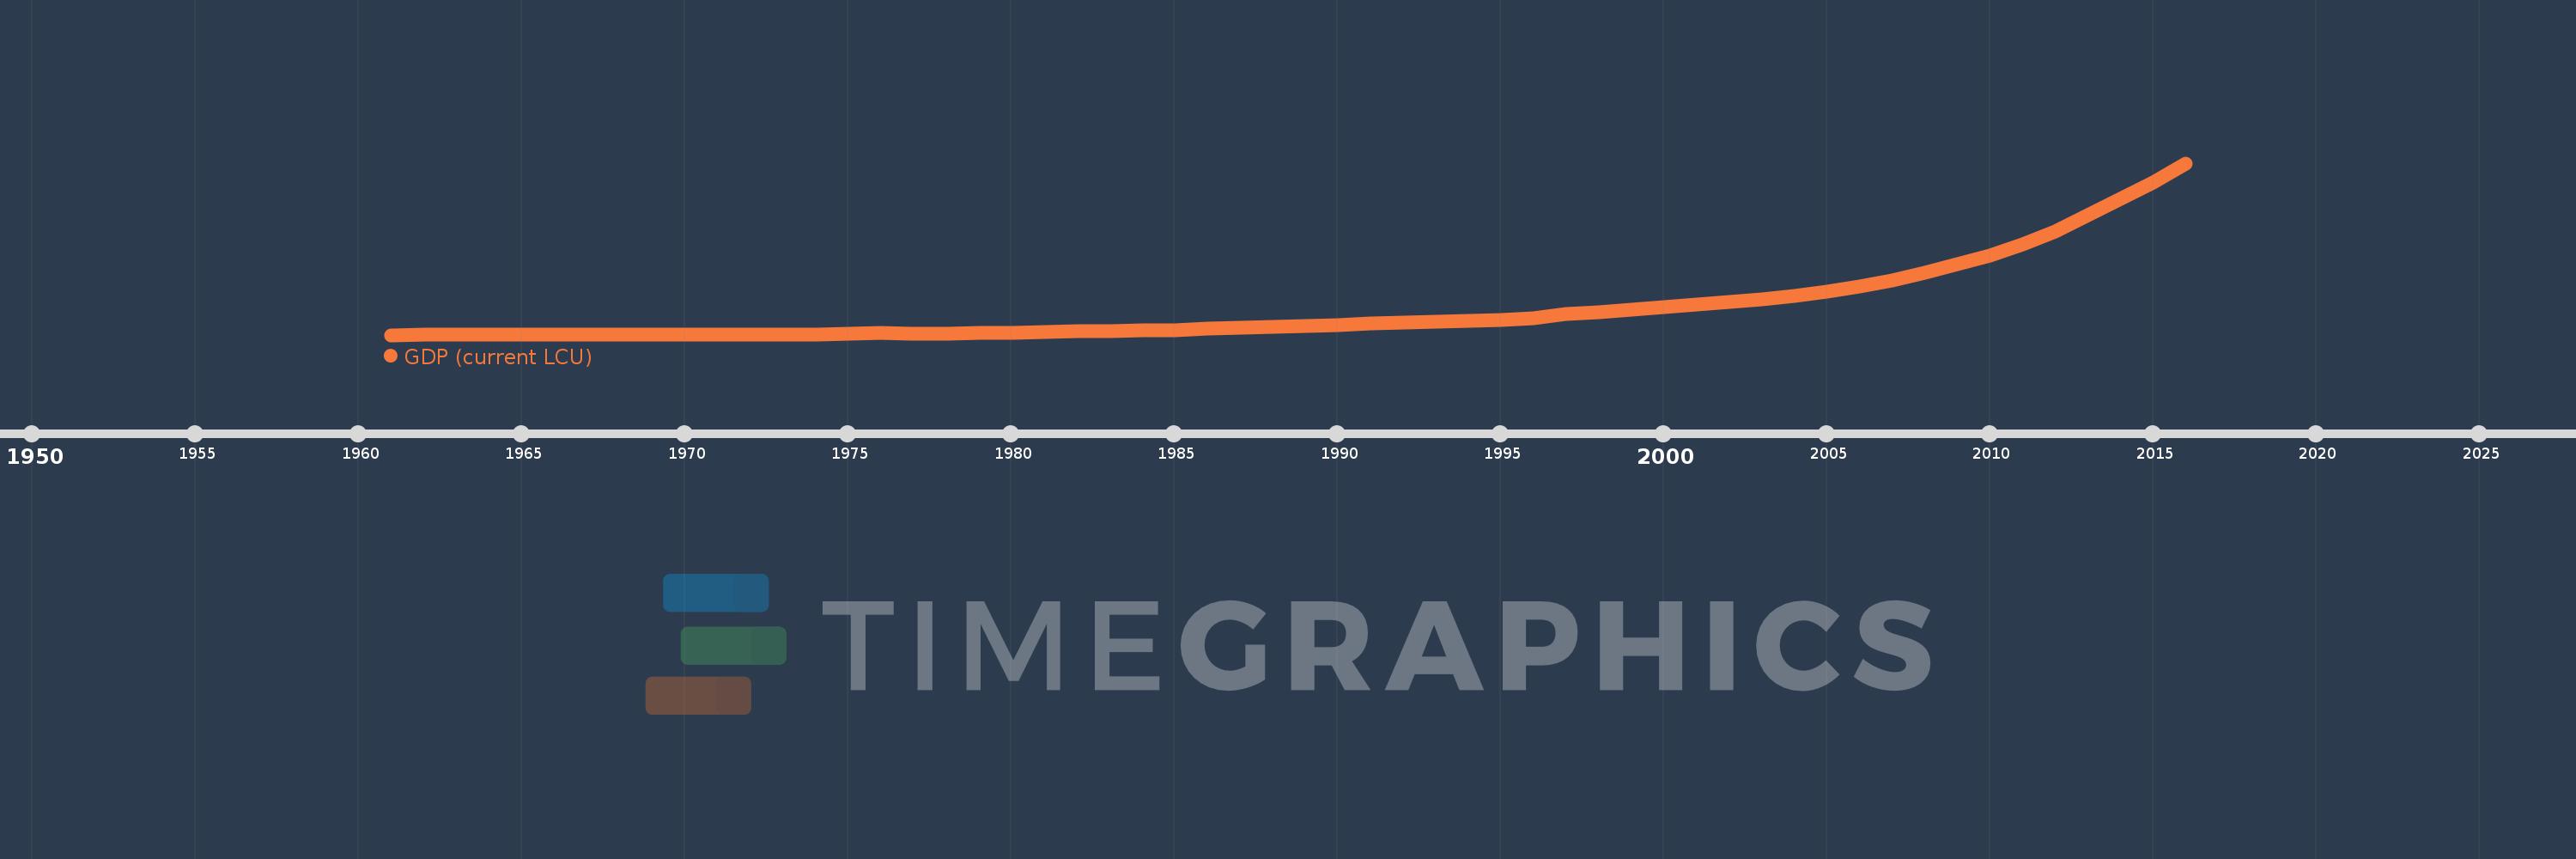
GDP (current LCU)
2016,2015,2014,2013,2012,2011,2010,2009,2008,2007,2006,2005,2004,2003,2002,2001,2000,1999,1998,1997,1996,1995,1994,1993,1992,1991,1990,1989,1988,1987,1986,1985,1984,1983,1982,1981,1980,1979,1978,1977,1976,1975,1974,1973,1972,1971,1970,1969,1968,1967,1966,1965,1964,1963,1962,1961
Estas estadísticas en otros países:
AfghanistanAlbaniaAlgeriaAndorraAngolaAntigua and BarbudaArgentinaArmeniaArubaAustraliaAustriaAzerbaijanBahamas, TheBahrainBangladeshBarbadosBelarusBelgiumBelizeBeninBermudaBhutanBoliviaBosnia and HerzegovinaBotswanaBrazilBrunei DarussalamBulgariaBurkina FasoBurundiCabo VerdeCambodiaCameroonCanadaCayman IslandsCentral African RepublicChadChannel IslandsChileChinaColombiaComorosCongo, Dem. Rep.Congo, Rep.Costa RicaCote d'IvoireCroatiaCubaCyprusCzech RepublicDenmarkDjiboutiDominicaDominican RepublicEcuadorEgypt, Arab Rep.El SalvadorEquatorial GuineaEritreaEstoniaEthiopiaFaroe IslandsFijiFinlandFranceFrench PolynesiaGabonGambia, TheGeorgiaGermanyGhanaGreeceGreenlandGrenadaGuatemalaGuineaGuinea-BissauGuyanaHaitiHondurasHong Kong SAR, ChinaHungaryIcelandIndiaIndonesiaIran, Islamic Rep.IraqIrelandIsle of ManIsraelItalyJamaicaJapanJordanKazakhstanKenyaKiribatiKorea, Rep.KosovoKuwaitKyrgyz RepublicLao PDRLatviaLebanonLesothoLiberiaLibyaLiechtensteinLithuaniaLuxembourgMacao SAR, ChinaMacedonia, FYRMadagascarMalawiMalaysiaMaldivesMaliMaltaMarshall IslandsMauritaniaMauritiusMexicoMicronesia, Fed. Sts.MoldovaMonacoMongoliaMontenegroMoroccoMozambiqueMyanmarNamibiaNauruNepalNetherlandsNew CaledoniaNew ZealandNicaraguaNigerNigeriaNorwayOmanPakistanPalauPanamaPapua New GuineaParaguayPeruPhilippinesPolandPortugalPuerto RicoQatarRomaniaRussian FederationRwandaSamoaSan MarinoSao Tome and PrincipeSaudi ArabiaSenegalSerbiaSeychellesSierra LeoneSingaporeSint Maarten (Dutch part)Slovak RepublicSloveniaSolomon IslandsSomaliaSouth AfricaSouth SudanSpainSri LankaSt. Kitts and NevisSt. LuciaSt. Vincent and the GrenadinesSudanSurinameSwazilandSwedenSwitzerlandSyrian Arab RepublicTajikistanTanzaniaThailandTimor-LesteTogoTongaTrinidad and TobagoTunisiaTurkeyTurkmenistanTuvaluUgandaUkraineUnited Arab EmiratesUnited KingdomUnited StatesUruguayUzbekistanVanuatuVenezuela, RBVietnamVirgin Islands (U.S.)West Bank and GazaYemen, Rep.ZambiaZimbabwe línea de tiempo (timeline):
En esta escala de tiempo se presenta un gráfico de 1961 y 2016 de Bangladesh. Los datos de 1960 están ausentes. El número de observaciones reales por fecha: 56.
Fuente (nombre):
Indicadores del desarrollo mundial
Fuente (organización):
World Bank national accounts data, and OECD National Accounts data files.
Categorías:
Economy & Growth
Se ha actualizado:
23 abr 2017 año
Los indicadores de los cambios de valor en los últimos años
En promedio:
2.42 billones
Mínimo:
20.519 bn
1 ene 1961 año
Máximo:
15.158 billones
1 ene 2016 año
A la fecha de observación
Valor
Cambio absoluto
El cambio con respecto al valor anterior
1 ene 1961 año
20.519 bn
+20.519 bn
0.0%
1 ene 1962 año
23.124 bn
+2.605 bn
12.69%
1 ene 1963 año
24.391 bn
+1.266 bn
5.48%
1 ene 1964 año
25.533 bn
+1.143 bn
4.68%
1 ene 1965 año
25.853 bn
+319.662 millones
1.25%
1 ene 1966 año
28.352 bn
+2.499 bn
9.67%
1 ene 1967 año
30.911 bn
+2.559 bn
9.02%
1 ene 1968 año
34.817 bn
+3.907 bn
12.64%
1 ene 1969 año
35.922 bn
+1.105 bn
3.17%
1 ene 1970 año
40.661 bn
+4.739 bn
13.19%
1 ene 1971 año
43.165 bn
+2.504 bn
6.16%
1 ene 1972 año
42.009 bn
-1.156 bn
-2.68%
1 ene 1973 año
37.729 bn
-4.279 bn
-10.19%
1 ene 1974 año
62.923 bn
+25.193 bn
66.77%
1 ene 1975 año
99.674 bn
+36.751 bn
58.41%
1 ene 1976 año
172.624 bn
+72.949 bn
73.19%
1 ene 1977 año
150.239 bn
-22.384 bn
-12.97%
1 ene 1978 año
149.303 bn
-935.853 millones
-0.62%
1 ene 1979 año
200.82 bn
+51.517 bn
34.5%
1 ene 1980 año
236.907 bn
+36.086 bn
17.97%
1 ene 1981 año
280.777 bn
+43.87 bn
18.52%
1 ene 1982 año
330.88 bn
+50.103 bn
17.84%
1 ene 1983 año
371.249 bn
+40.369 bn
12.2%
1 ene 1984 año
418.391 bn
+47.142 bn
12.7%
1 ene 1985 año
473.021 bn
+54.63 bn
13.06%
1 ene 1986 año
579.239 bn
+106.218 bn
22.46%
1 ene 1987 año
653.221 bn
+73.982 bn
12.77%
1 ene 1988 año
753.239 bn
+100.018 bn
15.31%
1 ene 1989 año
829.265 bn
+76.026 bn
10.09%
1 ene 1990 año
923.893 bn
+94.628 bn
11.41%
1 ene 1991 año
1.04 billones
+115.692 bn
12.52%
1 ene 1992 año
1.105 billones
+65.597 bn
6.31%
1 ene 1993 año
1.195 billones
+90.242 bn
8.17%
1 ene 1994 año
1.254 billones
+58.27 bn
4.87%
1 ene 1995 año
1.354 billones
+100.429 bn
8.01%
1 ene 1996 año
1.525 billones
+171.055 bn
12.63%
1 ene 1997 año
1.899 billones
+374.156 bn
24.53%
1 ene 1998 año
2.06 billones
+160.698 bn
8.46%
1 ene 1999 año
2.269 billones
+209.267 bn
10.16%
1 ene 2000 año
2.465 billones
+195.79 bn
8.63%
1 ene 2001 año
2.685 billones
+219.945 bn
8.92%
1 ene 2002 año
2.913 billones
+228.336 bn
8.5%
1 ene 2003 año
3.143 billones
+229.434 bn
7.88%
1 ene 2004 año
3.483 billones
+340.398 bn
10.83%
1 ene 2005 año
3.833 billones
+349.738 bn
10.04%
1 ene 2006 año
4.271 billones
+437.801 bn
11.42%
1 ene 2007 año
4.823 billones
+552.629 bn
12.94%
1 ene 2008 año
5.498 billones
+674.627 bn
13.99%
1 ene 2009 año
6.287 billones
+788.825 bn
14.35%
1 ene 2010 año
7.051 billones
+763.896 bn
12.15%
1 ene 2011 año
7.975 billones
+924.669 bn
13.11%
1 ene 2012 año
9.158 billones
+1.183 billones
14.83%
1 ene 2013 año
10.552 billones
+1.394 billones
15.22%
1 ene 2014 año
11.989 billones
+1.437 billones
13.62%
1 ene 2015 año
13.437 billones
+1.448 billones
12.07%
1 ene 2016 año
15.158 billones
+1.721 billones
12.81%
Ranking de los países por los datos estadísticos actuales


Comentarios: