30
/es/
AIzaSyAYiBZKx7MnpbEhh9jyipgxe19OcubqV5w
April 1, 2024
119870
Djibouti
DJI
true
2
1
GDP (current LCU)
2016,2015,2014,2013,2012,2011,2010,2009,2008,2007,2006,2005,2004,2003,2002,2001,2000,1999,1998,1997,1996,1995,1994,1993,1992,1991,1990,1989,1988,1986
Download
Estadísticas Globales de la Biblioteca →Djibouti →

GDP (current LCU)

Estas estadísticas en otros países:

AfghanistanAlbaniaAlgeriaAndorraAngolaAntigua and BarbudaArgentinaArmeniaArubaAustraliaAustriaAzerbaijanBahamas, TheBahrainBangladeshBarbadosBelarusBelgiumBelizeBeninBermudaBhutanBoliviaBosnia and HerzegovinaBotswanaBrazilBrunei DarussalamBulgariaBurkina FasoBurundiCabo VerdeCambodiaCameroonCanadaCayman IslandsCentral African RepublicChadChannel IslandsChileChinaColombiaComorosCongo, Dem. Rep.Congo, Rep.Costa RicaCote d'IvoireCroatiaCubaCyprusCzech RepublicDenmarkDjiboutiDominicaDominican RepublicEcuadorEgypt, Arab Rep.El SalvadorEquatorial GuineaEritreaEstoniaEthiopiaFaroe IslandsFijiFinlandFranceFrench PolynesiaGabonGambia, TheGeorgiaGermanyGhanaGreeceGreenlandGrenadaGuatemalaGuineaGuinea-BissauGuyanaHaitiHondurasHong Kong SAR, ChinaHungaryIcelandIndiaIndonesiaIran, Islamic Rep.IraqIrelandIsle of ManIsraelItalyJamaicaJapanJordanKazakhstanKenyaKiribatiKorea, Rep.KosovoKuwaitKyrgyz RepublicLao PDRLatviaLebanonLesothoLiberiaLibyaLiechtensteinLithuaniaLuxembourgMacao SAR, ChinaMacedonia, FYRMadagascarMalawiMalaysiaMaldivesMaliMaltaMarshall IslandsMauritaniaMauritiusMexicoMicronesia, Fed. Sts.MoldovaMonacoMongoliaMontenegroMoroccoMozambiqueMyanmarNamibiaNauruNepalNetherlandsNew CaledoniaNew ZealandNicaraguaNigerNigeriaNorwayOmanPakistanPalauPanamaPapua New GuineaParaguayPeruPhilippinesPolandPortugalPuerto RicoQatarRomaniaRussian FederationRwandaSamoaSan MarinoSao Tome and PrincipeSaudi ArabiaSenegalSerbiaSeychellesSierra LeoneSingaporeSint Maarten (Dutch part)Slovak RepublicSloveniaSolomon IslandsSomaliaSouth AfricaSouth SudanSpainSri LankaSt. Kitts and NevisSt. LuciaSt. Vincent and the GrenadinesSudanSurinameSwazilandSwedenSwitzerlandSyrian Arab RepublicTajikistanTanzaniaThailandTimor-LesteTogoTongaTrinidad and TobagoTunisiaTurkeyTurkmenistanTuvaluUgandaUkraineUnited Arab EmiratesUnited KingdomUnited StatesUruguayUzbekistanVanuatuVenezuela, RBVietnamVirgin Islands (U.S.)West Bank and GazaYemen, Rep.ZambiaZimbabwe

línea de tiempo (timeline):

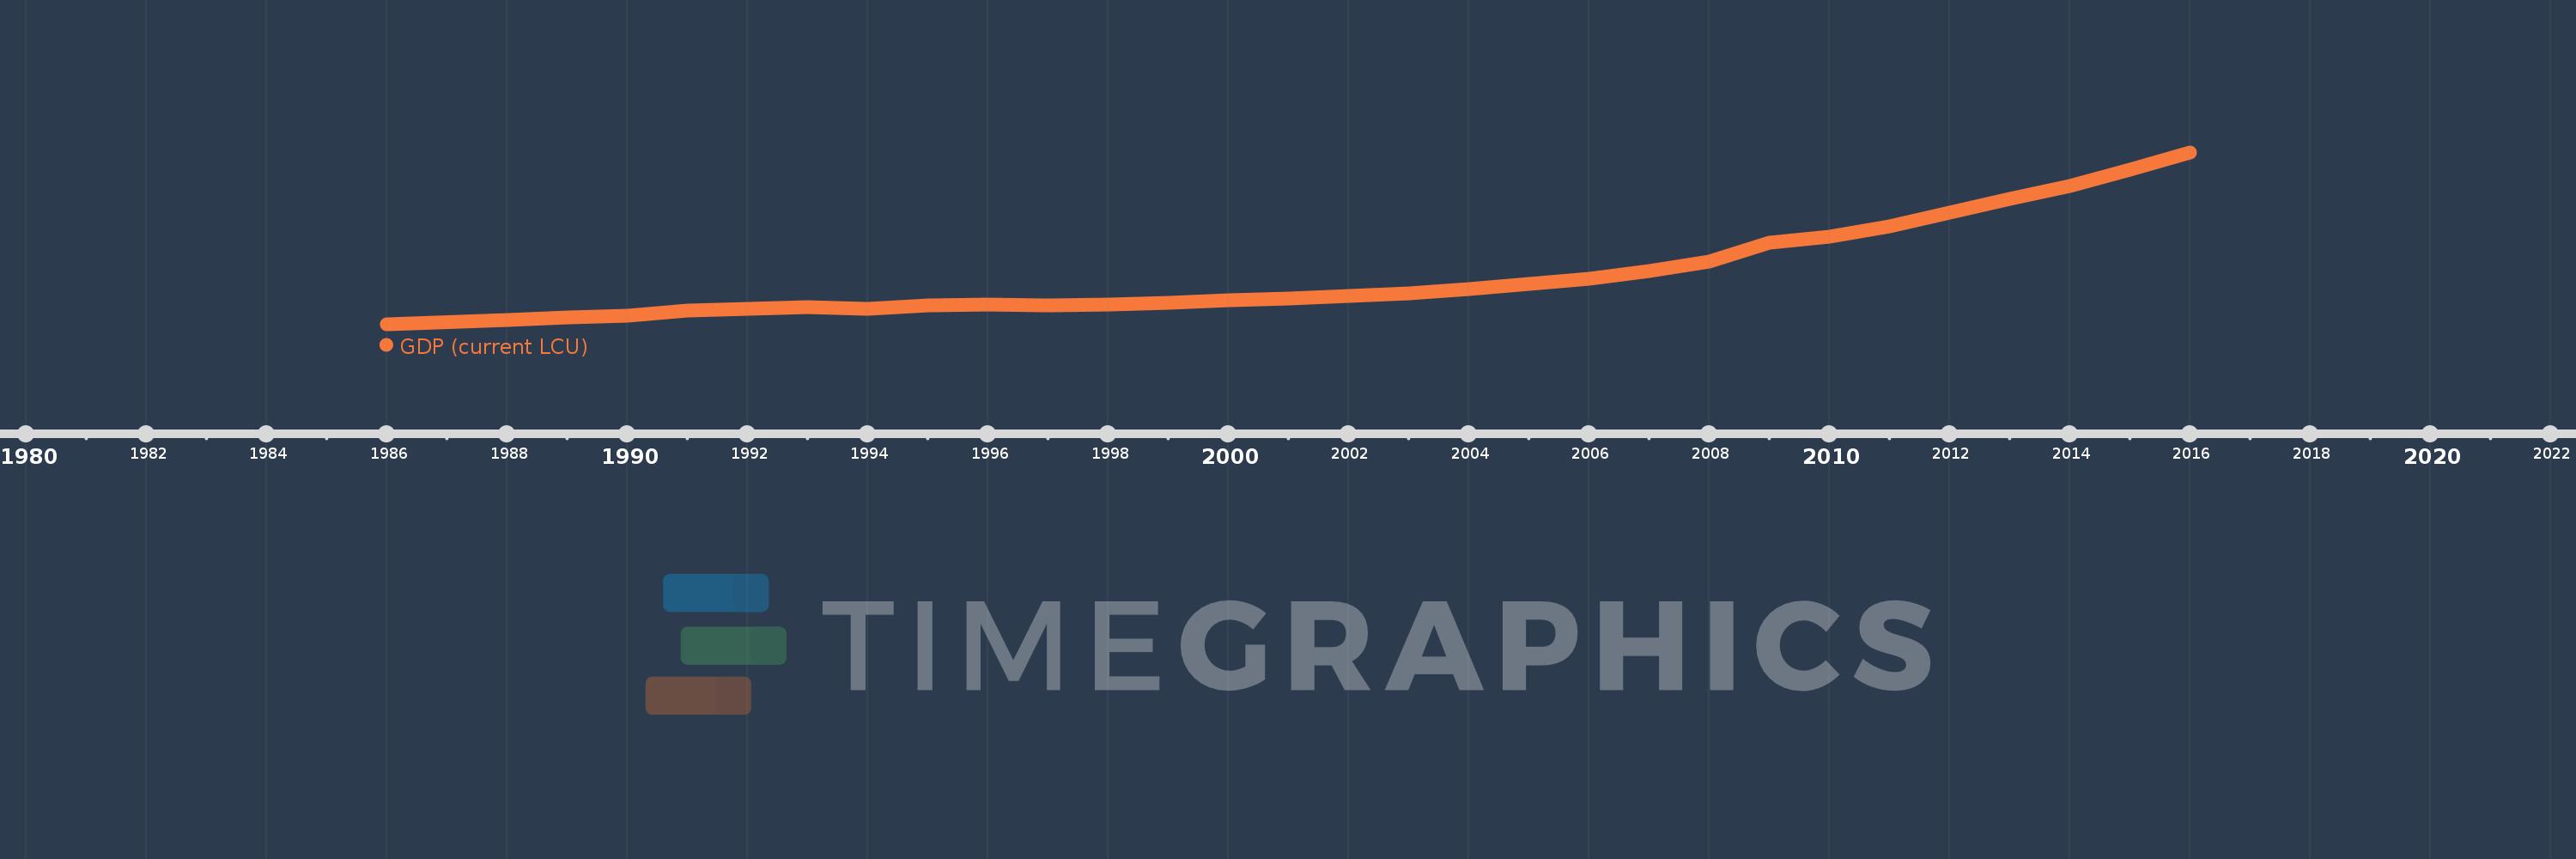
En esta escala de tiempo se presenta un gráfico de 1986 y 2016 de Djibouti. Los datos de 1985 están ausentes. El número de observaciones reales por fecha: 30.

Fuente (nombre):

Indicadores del desarrollo mundial

Fuente (organización):

World Bank national accounts data, and OECD National Accounts data files.

Categorías:

Economy & Growth

Se ha actualizado:

23 abr 2017 año

Los indicadores de los cambios de valor en los últimos años

En promedio:
132.003 bn
Mínimo:
60.601 bn
1 ene 1986 año
Máximo:
306.922 bn
1 ene 2016 año
A la fecha de observación
Valor
Cambio absoluto
El cambio con respecto al valor anterior
1 ene 1986 año
60.601 bn
+60.601 bn
0.0%
1 ene 1988 año
66.356 bn
+5.755 bn
9.5%
1 ene 1989 año
70.341 bn
+3.985 bn
6.01%
1 ene 1990 año
72.727 bn
+2.386 bn
3.39%
1 ene 1991 año
80.388 bn
+7.661 bn
10.53%
1 ene 1992 año
82.182 bn
+1.794 bn
2.23%
1 ene 1993 año
84.961 bn
+2.779 bn
3.38%
1 ene 1994 año
82.827 bn
-2.134 bn
-2.51%
1 ene 1995 año
87.383 bn
+4.557 bn
5.5%
1 ene 1996 año
88.456 bn
+1.073 bn
1.23%
1 ene 1997 año
87.795 bn
-661.0 millones
-0.75%
1 ene 1998 año
89.336 bn
+1.541 bn
1.76%
1 ene 1999 año
91.396 bn
+2.06 bn
2.31%
1 ene 2000 año
95.273 bn
+3.877 bn
4.24%
1 ene 2001 año
97.965 bn
+2.693 bn
2.83%
1 ene 2002 año
101.731 bn
+3.765 bn
3.84%
1 ene 2003 año
105.055 bn
+3.324 bn
3.27%
1 ene 2004 año
110.55 bn
+5.496 bn
5.23%
1 ene 2005 año
118.375 bn
+7.825 bn
7.08%
1 ene 2006 año
125.939 bn
+7.564 bn
6.39%
1 ene 2007 año
136.645 bn
+10.706 bn
8.5%
1 ene 2008 año
150.693 bn
+14.048 bn
10.28%
1 ene 2009 año
177.562 bn
+26.869 bn
17.83%
1 ene 2010 año
186.449 bn
+8.887 bn
5.01%
1 ene 2011 año
200.578 bn
+14.129 bn
7.58%
1 ene 2012 año
220.222 bn
+19.644 bn
9.79%
1 ene 2013 año
240.569 bn
+20.347 bn
9.24%
1 ene 2014 año
258.584 bn
+18.015 bn
7.49%
1 ene 2015 año
282.221 bn
+23.637 bn
9.14%
1 ene 2016 año
306.922 bn
+24.702 bn
8.75%

Ranking de los países por los datos estadísticos actuales