29
/es/
es
AIzaSyAYiBZKx7MnpbEhh9jyipgxe19OcubqV5w
April 1, 2024
77994
Bangladesh
BGD
true
2
1
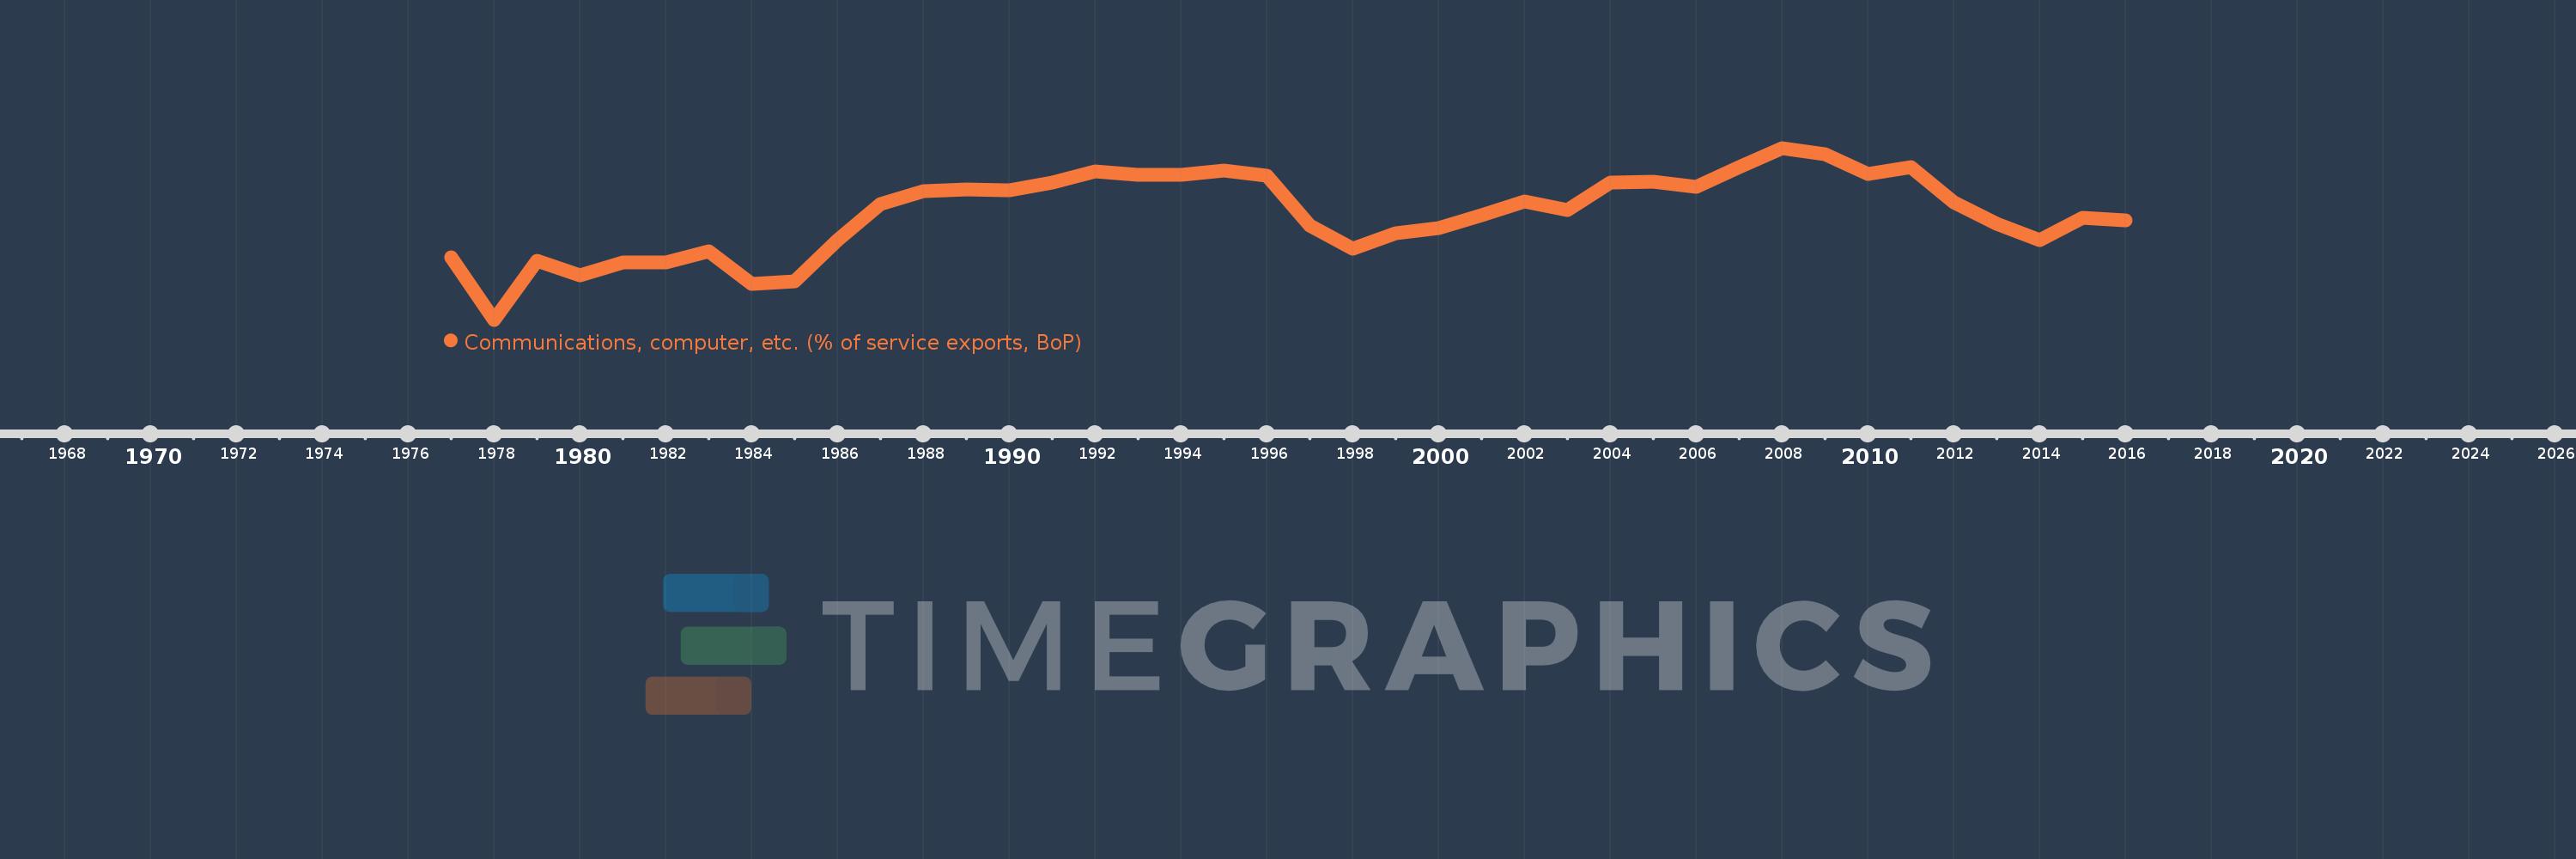
Communications, computer, etc. (% of service exports, BoP)
2016,2015,2014,2013,2012,2011,2010,2009,2008,2007,2006,2005,2004,2003,2002,2001,2000,1999,1998,1997,1996,1995,1994,1993,1992,1991,1990,1989,1988,1987,1986,1985,1984,1983,1982,1981,1980,1979,1978,1977
Estas estadísticas en otros países:
AfghanistanAlbaniaAlgeriaAngolaAntigua and BarbudaArab WorldArgentinaArmeniaArubaAustraliaAustriaAzerbaijanBahamas, TheBahrainBangladeshBarbadosBelarusBelgiumBelizeBeninBermudaBhutanBoliviaBosnia and HerzegovinaBotswanaBrazilBrunei DarussalamBulgariaBurkina FasoBurundiCabo VerdeCambodiaCameroonCanadaCaribbean small statesCentral African RepublicCentral Europe and the BalticsChadChileChinaColombiaComorosCongo, Dem. Rep.Congo, Rep.Costa RicaCote d'IvoireCroatiaCuracaoCyprusCzech RepublicDenmarkDjiboutiDominicaDominican RepublicEarly-demographic dividendEast Asia & PacificEast Asia & Pacific (excluding high income)East Asia & Pacific (IDA & IBRD countries)EcuadorEgypt, Arab Rep.El SalvadorEquatorial GuineaEritreaEstoniaEthiopiaEuro areaEurope & Central AsiaEurope & Central Asia (excluding high income)Europe & Central Asia (IDA & IBRD countries)European UnionFaroe IslandsFijiFinlandFragile and conflict affected situationsFranceFrench PolynesiaGabonGambia, TheGeorgiaGermanyGhanaGreeceGrenadaGuatemalaGuineaGuinea-BissauGuyanaHaitiHeavily indebted poor countries (HIPC)High incomeHondurasHong Kong SAR, ChinaHungaryIBRD onlyIcelandIDA & IBRD totalIDA onlyIDA totalIndiaIndonesiaIran, Islamic Rep.IraqIrelandIsraelItalyJamaicaJapanJordanKazakhstanKenyaKiribatiKorea, Rep.KosovoKuwaitKyrgyz RepublicLao PDRLate-demographic dividendLatin America & Caribbean Latin America & Caribbean (excluding high income)Latin America & the Caribbean (IDA & IBRD countries)LatviaLeast developed countries: UN classificationLebanonLesothoLiberiaLibyaLithuaniaLow & middle incomeLow incomeLower middle incomeLuxembourgMacao SAR, ChinaMacedonia, FYRMadagascarMalawiMalaysiaMaldivesMaliMaltaMarshall IslandsMauritaniaMauritiusMexicoMicronesia, Fed. Sts.Middle East & North AfricaMiddle East & North Africa (excluding high income)Middle East & North Africa (IDA & IBRD countries)Middle incomeMoldovaMongoliaMontenegroMoroccoMozambiqueMyanmarNamibiaNepalNetherlandsNew CaledoniaNew ZealandNicaraguaNigerNigeriaNorth AmericaNorwayOECD membersOmanOther small statesPacific island small statesPakistanPalauPanamaPapua New GuineaParaguayPeruPhilippinesPolandPortugalPost-demographic dividendPre-demographic dividendQatarRomaniaRussian FederationRwandaSamoaSao Tome and PrincipeSaudi ArabiaSenegalSerbiaSeychellesSierra LeoneSingaporeSint Maarten (Dutch part)Slovak RepublicSloveniaSmall statesSolomon IslandsSouth AfricaSouth AsiaSouth Asia (IDA & IBRD)South SudanSpainSri LankaSt. Kitts and NevisSt. LuciaSt. Vincent and the GrenadinesSub-Saharan Africa Sub-Saharan Africa (excluding high income)Sub-Saharan Africa (IDA & IBRD countries)SudanSurinameSwazilandSwedenSwitzerlandSyrian Arab RepublicTajikistanTanzaniaThailandTimor-LesteTogoTongaTrinidad and TobagoTunisiaTurkeyTuvaluUgandaUkraineUnited KingdomUnited StatesUpper middle incomeUruguayVanuatuVenezuela, RBWest Bank and GazaWorldYemen, Rep.ZambiaZimbabwe línea de tiempo (timeline):
En esta escala de tiempo se presenta un gráfico de 1977 y 2016 de Bangladesh. Los datos de 1976 están ausentes. El número de observaciones reales por fecha: 40.
Fuente (nombre):
Indicadores del desarrollo mundial
Fuente (organización):
International Monetary Fund, Balance of Payments Statistics Yearbook and data files.
Categorías:
Economy & Growth, Trade
Se ha actualizado:
23 abr 2017 año
Los indicadores de los cambios de valor en los últimos años
Mínimo:
65.77
1 ene 1978 año
Máximo:
90.216
1 ene 2008 año
A la fecha de observación
Valor
Cambio absoluto
El cambio con respecto al valor anterior
1 ene 1977 año
74.673
+74.673
0.0%
1 ene 1978 año
65.77
-8.903
-11.92%
1 ene 1979 año
74.133
+8.363
12.72%
1 ene 1980 año
72.066
-2.067
-2.79%
1 ene 1981 año
73.965
+1.899
2.63%
1 ene 1982 año
73.94
-0.025
-0.03%
1 ene 1983 año
75.539
+1.599
2.16%
1 ene 1984 año
70.806
-4.732
-6.26%
1 ene 1985 año
71.237
+0.43
0.61%
1 ene 1986 año
77.139
+5.902
8.29%
1 ene 1987 año
82.26
+5.121
6.64%
1 ene 1988 año
84.102
+1.842
2.24%
1 ene 1989 año
84.269
+0.168
0.2%
1 ene 1990 año
84.237
-0.032
-0.04%
1 ene 1991 año
85.345
+1.108
1.32%
1 ene 1992 año
86.873
+1.528
1.79%
1 ene 1993 año
86.341
-0.532
-0.61%
1 ene 1994 año
86.378
+0.037
0.04%
1 ene 1995 año
86.952
+0.574
0.66%
1 ene 1996 año
86.297
-0.655
-0.75%
1 ene 1997 año
79.164
-7.134
-8.27%
1 ene 1998 año
75.86
-3.304
-4.17%
1 ene 1999 año
78.069
+2.209
2.91%
1 ene 2000 año
78.811
+0.742
0.95%
1 ene 2001 año
80.586
+1.775
2.25%
1 ene 2002 año
82.563
+1.977
2.45%
1 ene 2003 año
81.373
-1.19
-1.44%
1 ene 2004 año
85.343
+3.969
4.88%
1 ene 2005 año
85.412
+0.07
0.08%
1 ene 2006 año
84.623
-0.789
-0.92%
1 ene 2007 año
87.503
+2.88
3.4%
1 ene 2008 año
90.216
+2.712
3.1%
1 ene 2009 año
89.36
-0.855
-0.95%
1 ene 2010 año
86.53
-2.83
-3.17%
1 ene 2011 año
87.539
+1.009
1.17%
1 ene 2012 año
82.493
-5.046
-5.76%
1 ene 2013 año
79.468
-3.025
-3.67%
1 ene 2014 año
77.047
-2.422
-3.05%
1 ene 2015 año
80.283
+3.236
4.2%
1 ene 2016 año
79.936
-0.347
-0.43%
Ranking de los países por los datos estadísticos actuales


Comentarios: