29
/es/
es
AIzaSyAYiBZKx7MnpbEhh9jyipgxe19OcubqV5w
April 1, 2024
234473
Saudi Arabia
SAU
true
2
1
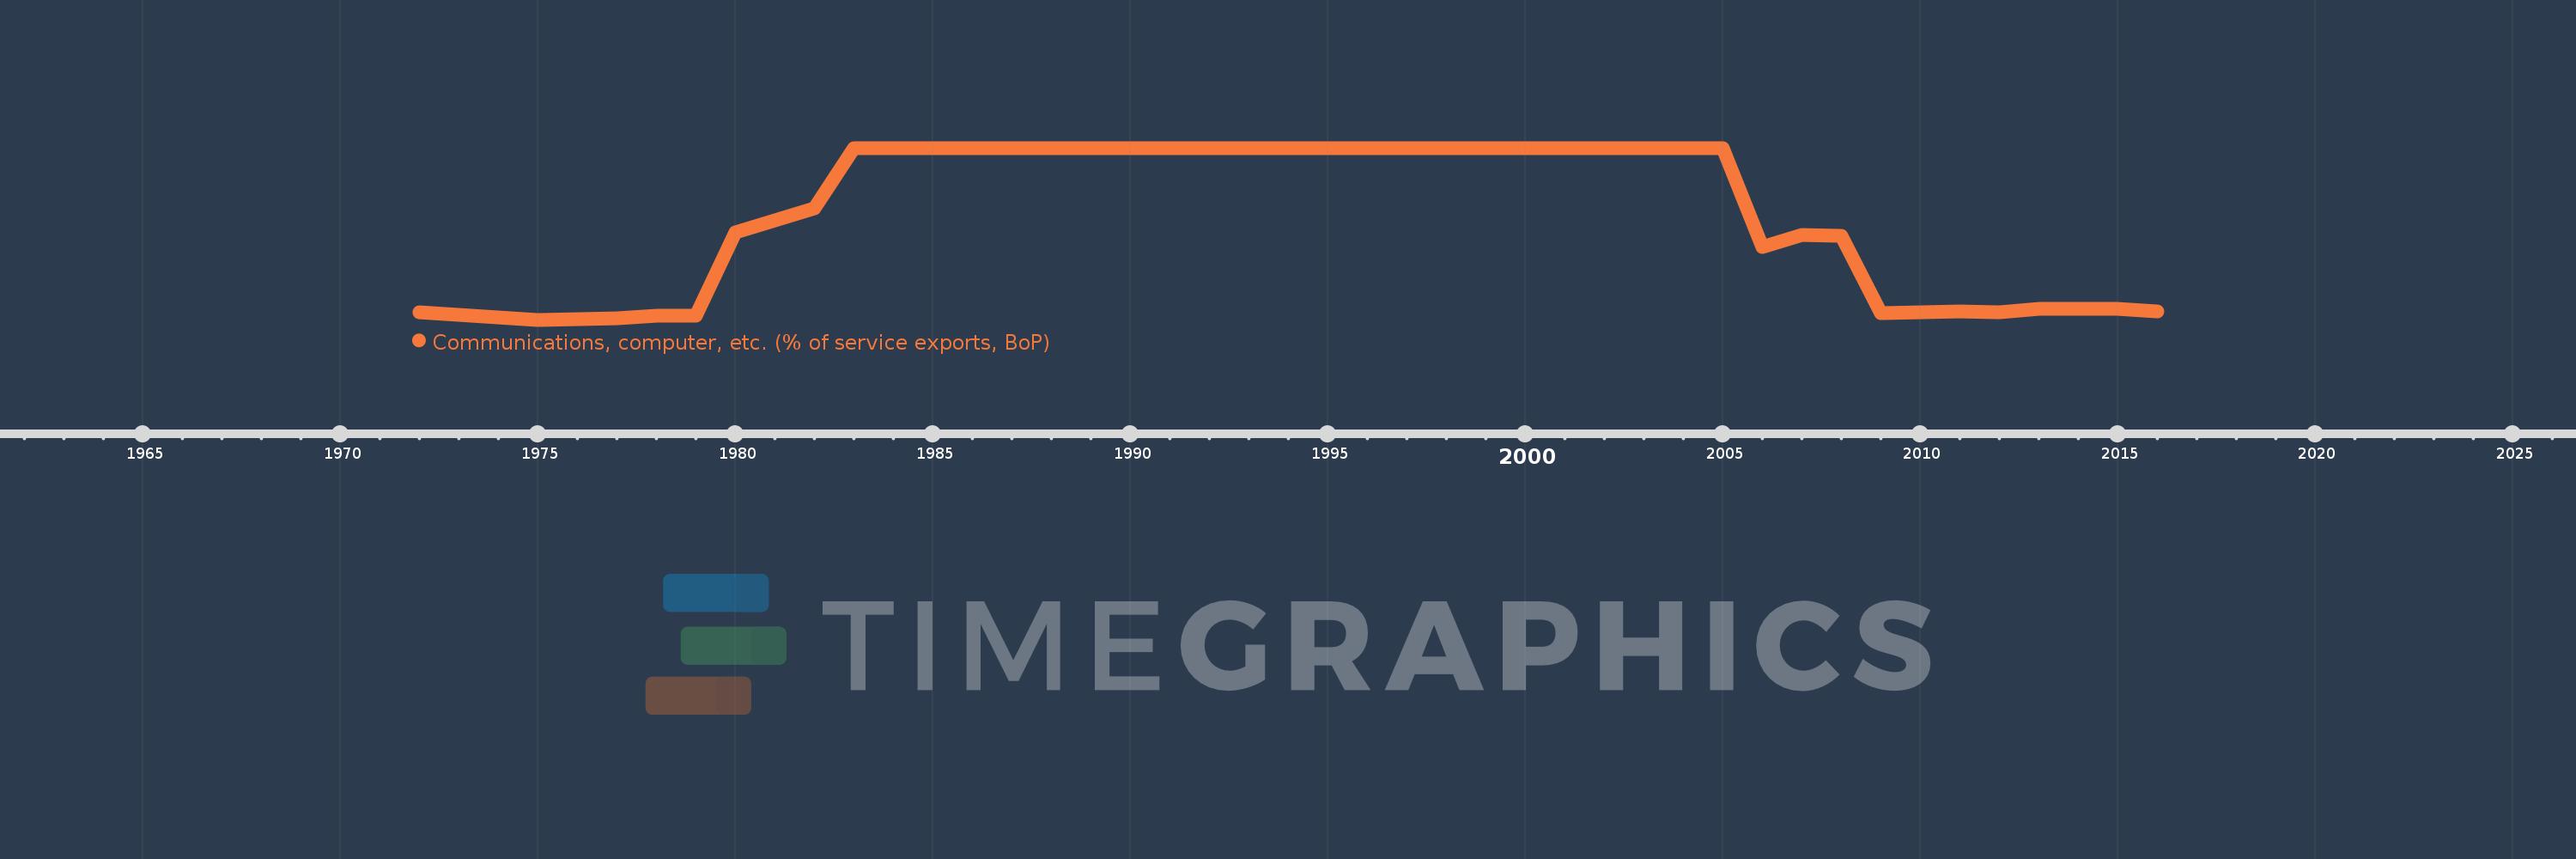
Communications, computer, etc. (% of service exports, BoP)
2016,2015,2014,2013,2012,2011,2010,2009,2008,2007,2006,2005,2004,2003,2002,2001,2000,1999,1998,1997,1996,1995,1994,1993,1992,1991,1990,1989,1988,1987,1986,1985,1984,1983,1982,1981,1980,1979,1978,1977,1976,1975,1974,1973,1972
Estas estadísticas en otros países:
AfghanistanAlbaniaAlgeriaAngolaAntigua and BarbudaArab WorldArgentinaArmeniaArubaAustraliaAustriaAzerbaijanBahamas, TheBahrainBangladeshBarbadosBelarusBelgiumBelizeBeninBermudaBhutanBoliviaBosnia and HerzegovinaBotswanaBrazilBrunei DarussalamBulgariaBurkina FasoBurundiCabo VerdeCambodiaCameroonCanadaCaribbean small statesCentral African RepublicCentral Europe and the BalticsChadChileChinaColombiaComorosCongo, Dem. Rep.Congo, Rep.Costa RicaCote d'IvoireCroatiaCuracaoCyprusCzech RepublicDenmarkDjiboutiDominicaDominican RepublicEarly-demographic dividendEast Asia & PacificEast Asia & Pacific (excluding high income)East Asia & Pacific (IDA & IBRD countries)EcuadorEgypt, Arab Rep.El SalvadorEquatorial GuineaEritreaEstoniaEthiopiaEuro areaEurope & Central AsiaEurope & Central Asia (excluding high income)Europe & Central Asia (IDA & IBRD countries)European UnionFaroe IslandsFijiFinlandFragile and conflict affected situationsFranceFrench PolynesiaGabonGambia, TheGeorgiaGermanyGhanaGreeceGrenadaGuatemalaGuineaGuinea-BissauGuyanaHaitiHeavily indebted poor countries (HIPC)High incomeHondurasHong Kong SAR, ChinaHungaryIBRD onlyIcelandIDA & IBRD totalIDA onlyIDA totalIndiaIndonesiaIran, Islamic Rep.IraqIrelandIsraelItalyJamaicaJapanJordanKazakhstanKenyaKiribatiKorea, Rep.KosovoKuwaitKyrgyz RepublicLao PDRLate-demographic dividendLatin America & Caribbean Latin America & Caribbean (excluding high income)Latin America & the Caribbean (IDA & IBRD countries)LatviaLeast developed countries: UN classificationLebanonLesothoLiberiaLibyaLithuaniaLow & middle incomeLow incomeLower middle incomeLuxembourgMacao SAR, ChinaMacedonia, FYRMadagascarMalawiMalaysiaMaldivesMaliMaltaMarshall IslandsMauritaniaMauritiusMexicoMicronesia, Fed. Sts.Middle East & North AfricaMiddle East & North Africa (excluding high income)Middle East & North Africa (IDA & IBRD countries)Middle incomeMoldovaMongoliaMontenegroMoroccoMozambiqueMyanmarNamibiaNepalNetherlandsNew CaledoniaNew ZealandNicaraguaNigerNigeriaNorth AmericaNorwayOECD membersOmanOther small statesPacific island small statesPakistanPalauPanamaPapua New GuineaParaguayPeruPhilippinesPolandPortugalPost-demographic dividendPre-demographic dividendQatarRomaniaRussian FederationRwandaSamoaSao Tome and PrincipeSaudi ArabiaSenegalSerbiaSeychellesSierra LeoneSingaporeSint Maarten (Dutch part)Slovak RepublicSloveniaSmall statesSolomon IslandsSouth AfricaSouth AsiaSouth Asia (IDA & IBRD)South SudanSpainSri LankaSt. Kitts and NevisSt. LuciaSt. Vincent and the GrenadinesSub-Saharan Africa Sub-Saharan Africa (excluding high income)Sub-Saharan Africa (IDA & IBRD countries)SudanSurinameSwazilandSwedenSwitzerlandSyrian Arab RepublicTajikistanTanzaniaThailandTimor-LesteTogoTongaTrinidad and TobagoTunisiaTurkeyTuvaluUgandaUkraineUnited KingdomUnited StatesUpper middle incomeUruguayVanuatuVenezuela, RBWest Bank and GazaWorldYemen, Rep.ZambiaZimbabwe línea de tiempo (timeline):
En esta escala de tiempo se presenta un gráfico de 1972 y 2016 de Saudi Arabia. Los datos de 1971 están ausentes. El número de observaciones reales por fecha: 45.
Fuente (nombre):
Indicadores del desarrollo mundial
Fuente (organización):
International Monetary Fund, Balance of Payments Statistics Yearbook and data files.
Categorías:
Economy & Growth, Trade
Se ha actualizado:
23 abr 2017 año
Los indicadores de los cambios de valor en los últimos años
Mínimo:
1.747
1 ene 1975 año
Máximo:
100.0
1 ene 1983 año
A la fecha de observación
Valor
Cambio absoluto
El cambio con respecto al valor anterior
1 ene 1972 año
5.797
+5.797
0.0%
1 ene 1973 año
4.444
-1.353
-23.33%
1 ene 1974 año
3.03
-1.414
-31.82%
1 ene 1975 año
1.747
-1.284
-42.36%
1 ene 1976 año
2.027
+0.28
16.05%
1 ene 1977 año
2.639
+0.611
30.17%
1 ene 1978 año
4.032
+1.394
52.82%
1 ene 1979 año
4.159
+0.127
3.15%
1 ene 1980 año
51.641
+47.482
1.14 mil%
1 ene 1981 año
58.83
+7.189
13.92%
1 ene 1982 año
65.263
+6.433
10.93%
1 ene 1983 año
100.0
+34.737
53.23%
1 ene 1984 año
100.0
0.0
0.0%
1 ene 1985 año
100.0
0.0
0.0%
1 ene 1986 año
100.0
0.0
0.0%
1 ene 1987 año
100.0
0.0
0.0%
1 ene 1988 año
100.0
0.0
0.0%
1 ene 1989 año
100.0
0.0
0.0%
1 ene 1990 año
100.0
0.0
0.0%
1 ene 1991 año
100.0
0.0
0.0%
1 ene 1992 año
100.0
0.0
0.0%
1 ene 1993 año
100.0
0.0
0.0%
1 ene 1994 año
100.0
0.0
0.0%
1 ene 1995 año
100.0
0.0
0.0%
1 ene 1996 año
100.0
0.0
0.0%
1 ene 1997 año
100.0
0.0
0.0%
1 ene 1998 año
100.0
0.0
0.0%
1 ene 1999 año
100.0
0.0
0.0%
1 ene 2000 año
100.0
0.0
0.0%
1 ene 2001 año
100.0
0.0
0.0%
1 ene 2002 año
100.0
0.0
0.0%
1 ene 2003 año
100.0
0.0
0.0%
1 ene 2004 año
100.0
0.0
0.0%
1 ene 2005 año
100.0
0.0
0.0%
1 ene 2006 año
43.505
-56.495
-56.5%
1 ene 2007 año
50.225
+6.72
15.45%
1 ene 2008 año
49.87
-0.355
-0.71%
1 ene 2009 año
5.31
-44.56
-89.35%
1 ene 2010 año
5.981
+0.671
12.64%
1 ene 2011 año
6.542
+0.562
9.39%
1 ene 2012 año
6.156
-0.386
-5.9%
1 ene 2013 año
7.891
+1.734
28.18%
1 ene 2014 año
7.792
-0.099
-1.25%
1 ene 2015 año
8.027
+0.235
3.02%
1 ene 2016 año
6.459
-1.568
-19.53%
Ranking de los países por los datos estadísticos actuales


Comentarios: