29
/es/
es
AIzaSyAYiBZKx7MnpbEhh9jyipgxe19OcubqV5w
April 1, 2024
76783
Bahamas, The
BHS
true
2
1
Urban population
2016,2015,2014,2013,2012,2011,2010,2009,2008,2007,2006,2005,2004,2003,2002,2001,2000,1999,1998,1997,1996,1995,1994,1993,1992,1991,1990,1989,1988,1987,1986,1985,1984,1983,1982,1981,1980,1979,1978,1977,1976,1975,1974,1973,1972,1971,1970,1969,1968,1967,1966,1965,1964,1963,1962,1961
Estas estadísticas en otros países:
AfghanistanAlbaniaAlgeriaAmerican SamoaAndorraAngolaAntigua and BarbudaArab WorldArgentinaArmeniaArubaAustraliaAustriaAzerbaijanBahamas, TheBahrainBangladeshBarbadosBelarusBelgiumBelizeBeninBermudaBhutanBoliviaBosnia and HerzegovinaBotswanaBrazilBritish Virgin IslandsBrunei DarussalamBulgariaBurkina FasoBurundiCabo VerdeCambodiaCameroonCanadaCaribbean small statesCayman IslandsCentral African RepublicCentral Europe and the BalticsChadChannel IslandsChileChinaColombiaComorosCongo, Dem. Rep.Congo, Rep.Costa RicaCote d'IvoireCroatiaCubaCuracaoCyprusCzech RepublicDenmarkDjiboutiDominicaDominican RepublicEarly-demographic dividendEast Asia & PacificEast Asia & Pacific (excluding high income)East Asia & Pacific (IDA & IBRD countries)EcuadorEgypt, Arab Rep.El SalvadorEquatorial GuineaEritreaEstoniaEthiopiaEuro areaEurope & Central AsiaEurope & Central Asia (excluding high income)Europe & Central Asia (IDA & IBRD countries)European UnionFaroe IslandsFijiFinlandFragile and conflict affected situationsFranceFrench PolynesiaGabonGambia, TheGeorgiaGermanyGhanaGibraltarGreeceGreenlandGrenadaGuamGuatemalaGuineaGuinea-BissauGuyanaHaitiHeavily indebted poor countries (HIPC)High incomeHondurasHong Kong SAR, ChinaHungaryIBRD onlyIcelandIDA & IBRD totalIDA blendIDA onlyIDA totalIndiaIndonesiaIran, Islamic Rep.IraqIrelandIsle of ManIsraelItalyJamaicaJapanJordanKazakhstanKenyaKiribatiKorea, Dem. People’s Rep.Korea, Rep.KuwaitKyrgyz RepublicLao PDRLate-demographic dividendLatin America & Caribbean Latin America & Caribbean (excluding high income)Latin America & the Caribbean (IDA & IBRD countries)LatviaLeast developed countries: UN classificationLebanonLesothoLiberiaLibyaLiechtensteinLithuaniaLow & middle incomeLow incomeLower middle incomeLuxembourgMacao SAR, ChinaMacedonia, FYRMadagascarMalawiMalaysiaMaldivesMaliMaltaMarshall IslandsMauritaniaMauritiusMexicoMicronesia, Fed. Sts.Middle East & North AfricaMiddle East & North Africa (excluding high income)Middle East & North Africa (IDA & IBRD countries)Middle incomeMoldovaMonacoMongoliaMontenegroMoroccoMozambiqueMyanmarNamibiaNauruNepalNetherlandsNew CaledoniaNew ZealandNicaraguaNigerNigeriaNorth AmericaNorthern Mariana IslandsNorwayOECD membersOmanOther small statesPacific island small statesPakistanPalauPanamaPapua New GuineaParaguayPeruPhilippinesPolandPortugalPost-demographic dividendPre-demographic dividendPuerto RicoQatarRomaniaRussian FederationRwandaSamoaSan MarinoSao Tome and PrincipeSaudi ArabiaSenegalSerbiaSeychellesSierra LeoneSingaporeSint Maarten (Dutch part)Slovak RepublicSloveniaSmall statesSolomon IslandsSomaliaSouth AfricaSouth AsiaSouth Asia (IDA & IBRD)South SudanSpainSri LankaSt. Kitts and NevisSt. LuciaSt. Vincent and the GrenadinesSub-Saharan Africa Sub-Saharan Africa (excluding high income)Sub-Saharan Africa (IDA & IBRD countries)SudanSurinameSwazilandSwedenSwitzerlandSyrian Arab RepublicTajikistanTanzaniaThailandTimor-LesteTogoTongaTrinidad and TobagoTunisiaTurkeyTurkmenistanTurks and Caicos IslandsTuvaluUgandaUkraineUnited Arab EmiratesUnited KingdomUnited StatesUpper middle incomeUruguayUzbekistanVanuatuVenezuela, RBVietnamVirgin Islands (U.S.)West Bank and GazaWorldYemen, Rep.ZambiaZimbabwe línea de tiempo (timeline):
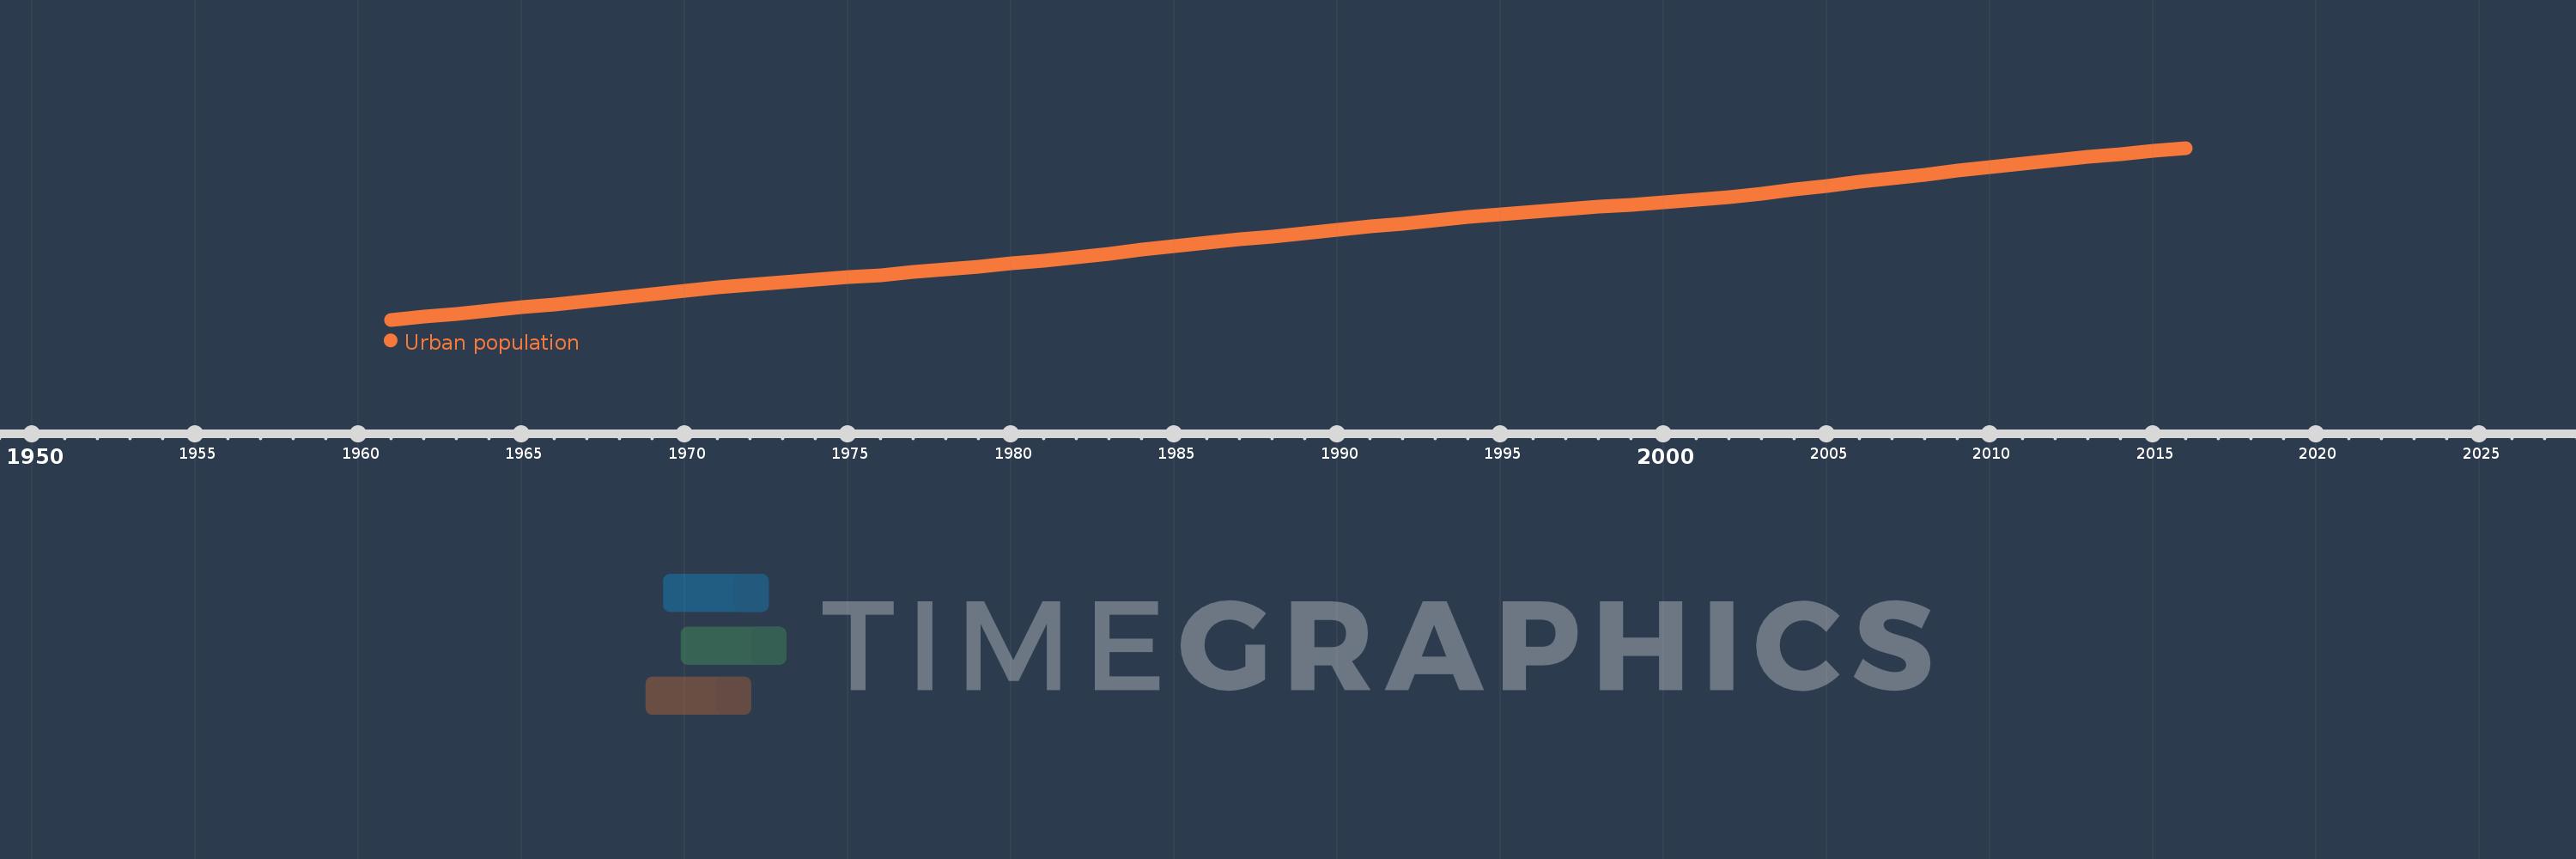
En esta escala de tiempo se presenta un gráfico de 1961 y 2016 de Bahamas, The. Los datos de 1960 están ausentes. El número de observaciones reales por fecha: 56.
Fuente (nombre):
Indicadores del desarrollo mundial
Fuente (organización):
World Bank Staff estimates based on United Nations, World Urbanization Prospects.
Categorías:
Climate Change, Urban Development
Se ha actualizado:
23 abr 2017 año
Los indicadores de los cambios de valor en los últimos años
Mínimo:
65.4 mil
1 ene 1961 año
Máximo:
321.567 mil
1 ene 2016 año
A la fecha de observación
Valor
Cambio absoluto
El cambio con respecto al valor anterior
1 ene 1961 año
65.4 mil
+65.4 mil
0.0%
1 ene 1962 año
69.587 mil
+4.187 mil
6.4%
1 ene 1963 año
74.094 mil
+4.507 mil
6.48%
1 ene 1964 año
78.851 mil
+4.757 mil
6.42%
1 ene 1965 año
83.75 mil
+4.899 mil
6.21%
1 ene 1966 año
88.711 mil
+4.961 mil
5.92%
1 ene 1967 año
93.732 mil
+5.021 mil
5.66%
1 ene 1968 año
98.783 mil
+5.051 mil
5.39%
1 ene 1969 año
103.769 mil
+4.986 mil
5.05%
1 ene 1970 año
108.558 mil
+4.789 mil
4.62%
1 ene 1971 año
113.069 mil
+4.511 mil
4.16%
1 ene 1972 año
117.237 mil
+4.168 mil
3.69%
1 ene 1973 año
121.09 mil
+3.853 mil
3.29%
1 ene 1974 año
124.752 mil
+3.662 mil
3.02%
1 ene 1975 año
128.422 mil
+3.67 mil
2.94%
1 ene 1976 año
132.25 mil
+3.828 mil
2.98%
1 ene 1977 año
136.282 mil
+4.032 mil
3.05%
1 ene 1978 año
140.478 mil
+4.196 mil
3.08%
1 ene 1979 año
144.844 mil
+4.366 mil
3.11%
1 ene 1980 año
149.345 mil
+4.501 mil
3.11%
1 ene 1981 año
153.997 mil
+4.652 mil
3.11%
1 ene 1982 año
159.061 mil
+5.064 mil
3.29%
1 ene 1983 año
164.261 mil
+5.2 mil
3.27%
1 ene 1984 año
169.531 mil
+5.27 mil
3.21%
1 ene 1985 año
174.782 mil
+5.251 mil
3.1%
1 ene 1986 año
179.942 mil
+5.16 mil
2.95%
1 ene 1987 año
184.961 mil
+5.019 mil
2.79%
1 ene 1988 año
189.862 mil
+4.901 mil
2.65%
1 ene 1989 año
194.728 mil
+4.866 mil
2.56%
1 ene 1990 año
199.681 mil
+4.953 mil
2.54%
1 ene 1991 año
204.655 mil
+4.974 mil
2.49%
1 ene 1992 año
209.069 mil
+4.414 mil
2.16%
1 ene 1993 año
213.686 mil
+4.617 mil
2.21%
1 ene 1994 año
218.337 mil
+4.651 mil
2.18%
1 ene 1995 año
222.764 mil
+4.427 mil
2.03%
1 ene 1996 año
226.813 mil
+4.049 mil
1.82%
1 ene 1997 año
230.382 mil
+3.569 mil
1.57%
1 ene 1998 año
233.58 mil
+3.198 mil
1.39%
1 ene 1999 año
236.716 mil
+3.136 mil
1.34%
1 ene 2000 año
240.212 mil
+3.496 mil
1.48%
1 ene 2001 año
244.297 mil
+4.085 mil
1.7%
1 ene 2002 año
248.767 mil
+4.47 mil
1.83%
1 ene 2003 año
253.884 mil
+5.117 mil
2.06%
1 ene 2004 año
259.464 mil
+5.58 mil
2.2%
1 ene 2005 año
265.211 mil
+5.747 mil
2.21%
1 ene 2006 año
270.901 mil
+5.69 mil
2.15%
1 ene 2007 año
276.478 mil
+5.577 mil
2.06%
1 ene 2008 año
281.98 mil
+5.502 mil
1.99%
1 ene 2009 año
287.382 mil
+5.402 mil
1.92%
1 ene 2010 año
292.676 mil
+5.294 mil
1.84%
1 ene 2011 año
297.862 mil
+5.186 mil
1.77%
1 ene 2012 año
302.925 mil
+5.063 mil
1.7%
1 ene 2013 año
307.842 mil
+4.917 mil
1.62%
1 ene 2014 año
312.595 mil
+4.753 mil
1.54%
1 ene 2015 año
317.173 mil
+4.578 mil
1.46%
1 ene 2016 año
321.567 mil
+4.394 mil
1.39%
Ranking de los países por los datos estadísticos actuales


Comentarios: