29
/es/
es
AIzaSyAYiBZKx7MnpbEhh9jyipgxe19OcubqV5w
April 1, 2024
252605
St. Vincent and the Grenadines
VCT
true
2
1
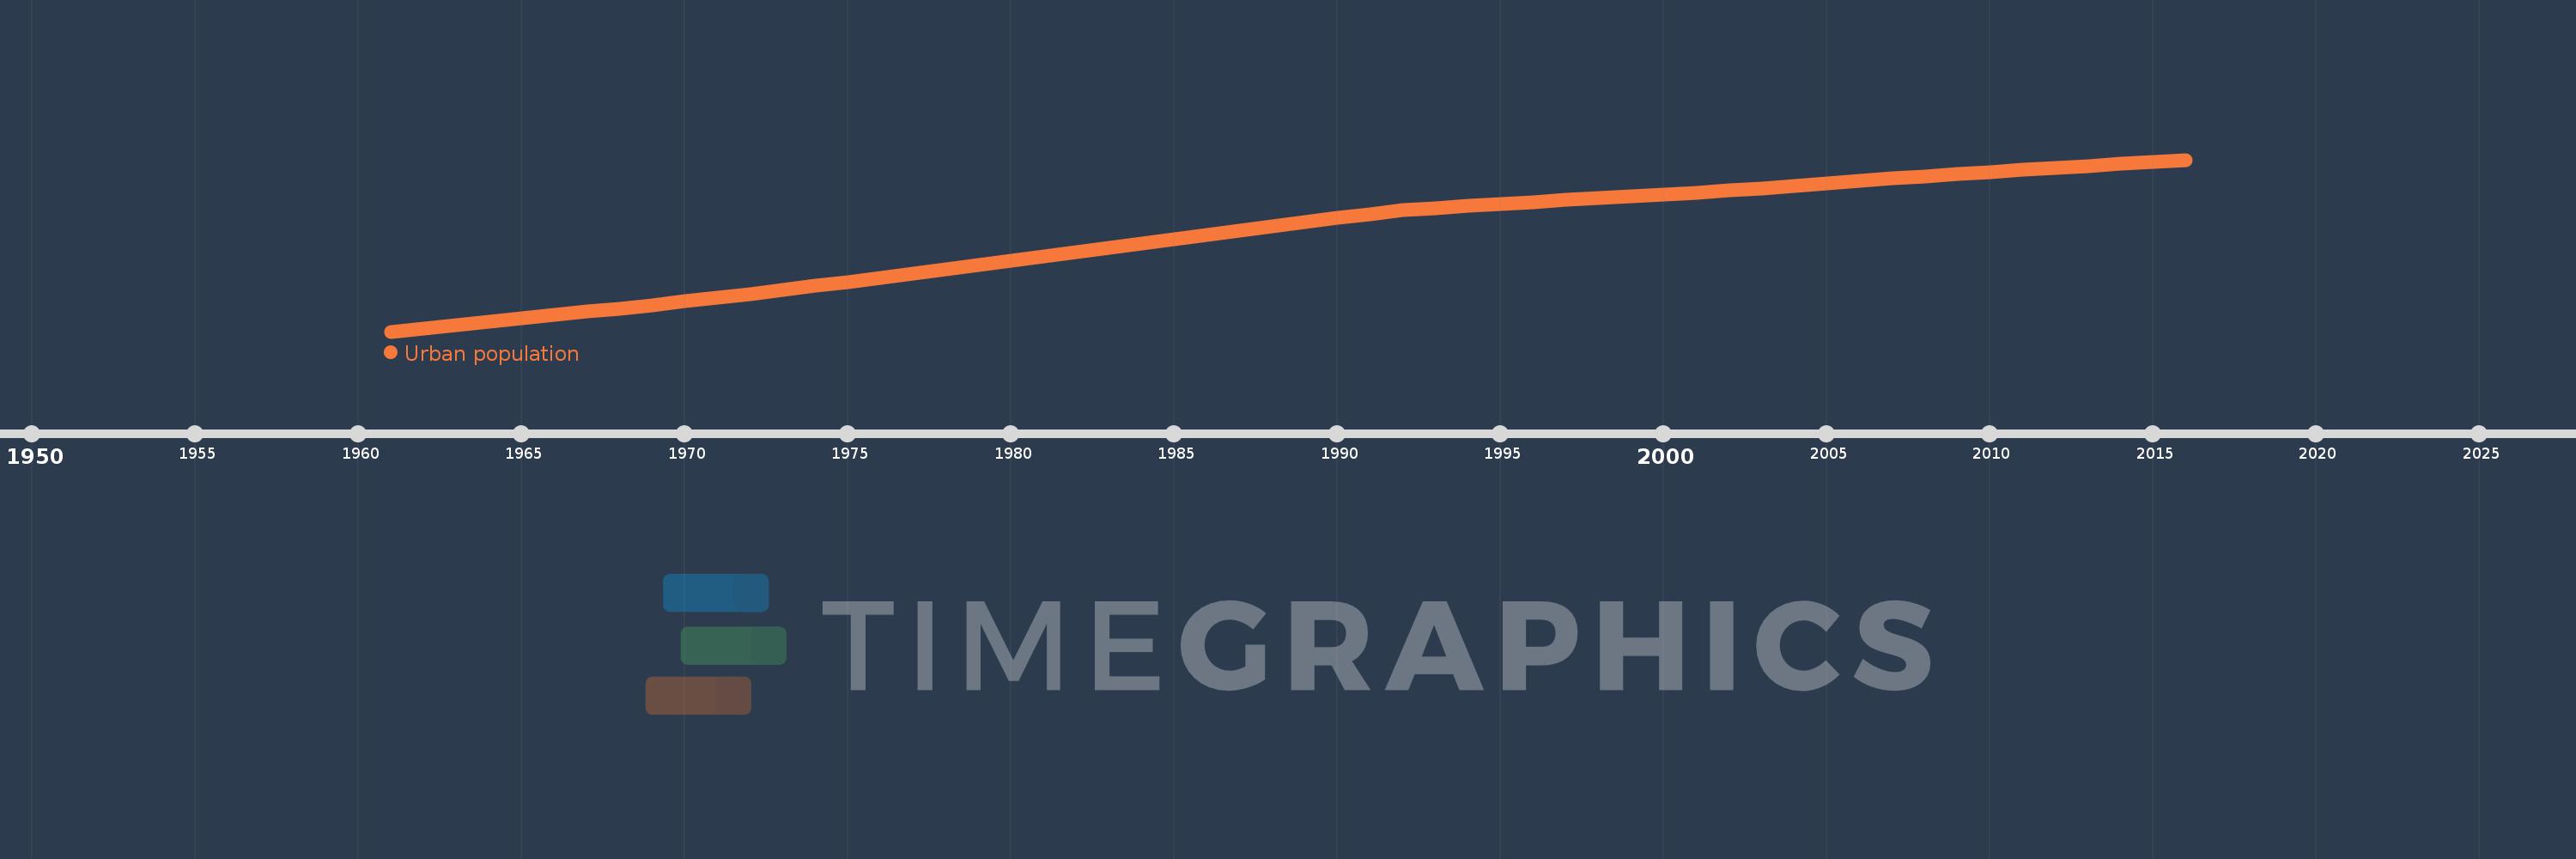
Urban population
2016,2015,2014,2013,2012,2011,2010,2009,2008,2007,2006,2005,2004,2003,2002,2001,2000,1999,1998,1997,1996,1995,1994,1993,1992,1991,1990,1989,1988,1987,1986,1985,1984,1983,1982,1981,1980,1979,1978,1977,1976,1975,1974,1973,1972,1971,1970,1969,1968,1967,1966,1965,1964,1963,1962,1961
Estas estadísticas en otros países:
AfghanistanAlbaniaAlgeriaAmerican SamoaAndorraAngolaAntigua and BarbudaArab WorldArgentinaArmeniaArubaAustraliaAustriaAzerbaijanBahamas, TheBahrainBangladeshBarbadosBelarusBelgiumBelizeBeninBermudaBhutanBoliviaBosnia and HerzegovinaBotswanaBrazilBritish Virgin IslandsBrunei DarussalamBulgariaBurkina FasoBurundiCabo VerdeCambodiaCameroonCanadaCaribbean small statesCayman IslandsCentral African RepublicCentral Europe and the BalticsChadChannel IslandsChileChinaColombiaComorosCongo, Dem. Rep.Congo, Rep.Costa RicaCote d'IvoireCroatiaCubaCuracaoCyprusCzech RepublicDenmarkDjiboutiDominicaDominican RepublicEarly-demographic dividendEast Asia & PacificEast Asia & Pacific (excluding high income)East Asia & Pacific (IDA & IBRD countries)EcuadorEgypt, Arab Rep.El SalvadorEquatorial GuineaEritreaEstoniaEthiopiaEuro areaEurope & Central AsiaEurope & Central Asia (excluding high income)Europe & Central Asia (IDA & IBRD countries)European UnionFaroe IslandsFijiFinlandFragile and conflict affected situationsFranceFrench PolynesiaGabonGambia, TheGeorgiaGermanyGhanaGibraltarGreeceGreenlandGrenadaGuamGuatemalaGuineaGuinea-BissauGuyanaHaitiHeavily indebted poor countries (HIPC)High incomeHondurasHong Kong SAR, ChinaHungaryIBRD onlyIcelandIDA & IBRD totalIDA blendIDA onlyIDA totalIndiaIndonesiaIran, Islamic Rep.IraqIrelandIsle of ManIsraelItalyJamaicaJapanJordanKazakhstanKenyaKiribatiKorea, Dem. People’s Rep.Korea, Rep.KuwaitKyrgyz RepublicLao PDRLate-demographic dividendLatin America & Caribbean Latin America & Caribbean (excluding high income)Latin America & the Caribbean (IDA & IBRD countries)LatviaLeast developed countries: UN classificationLebanonLesothoLiberiaLibyaLiechtensteinLithuaniaLow & middle incomeLow incomeLower middle incomeLuxembourgMacao SAR, ChinaMacedonia, FYRMadagascarMalawiMalaysiaMaldivesMaliMaltaMarshall IslandsMauritaniaMauritiusMexicoMicronesia, Fed. Sts.Middle East & North AfricaMiddle East & North Africa (excluding high income)Middle East & North Africa (IDA & IBRD countries)Middle incomeMoldovaMonacoMongoliaMontenegroMoroccoMozambiqueMyanmarNamibiaNauruNepalNetherlandsNew CaledoniaNew ZealandNicaraguaNigerNigeriaNorth AmericaNorthern Mariana IslandsNorwayOECD membersOmanOther small statesPacific island small statesPakistanPalauPanamaPapua New GuineaParaguayPeruPhilippinesPolandPortugalPost-demographic dividendPre-demographic dividendPuerto RicoQatarRomaniaRussian FederationRwandaSamoaSan MarinoSao Tome and PrincipeSaudi ArabiaSenegalSerbiaSeychellesSierra LeoneSingaporeSint Maarten (Dutch part)Slovak RepublicSloveniaSmall statesSolomon IslandsSomaliaSouth AfricaSouth AsiaSouth Asia (IDA & IBRD)South SudanSpainSri LankaSt. Kitts and NevisSt. LuciaSt. Vincent and the GrenadinesSub-Saharan Africa Sub-Saharan Africa (excluding high income)Sub-Saharan Africa (IDA & IBRD countries)SudanSurinameSwazilandSwedenSwitzerlandSyrian Arab RepublicTajikistanTanzaniaThailandTimor-LesteTogoTongaTrinidad and TobagoTunisiaTurkeyTurkmenistanTurks and Caicos IslandsTuvaluUgandaUkraineUnited Arab EmiratesUnited KingdomUnited StatesUpper middle incomeUruguayUzbekistanVanuatuVenezuela, RBVietnamVirgin Islands (U.S.)West Bank and GazaWorldYemen, Rep.ZambiaZimbabwe línea de tiempo (timeline):
En esta escala de tiempo se presenta un gráfico de 1961 y 2016 de St. Vincent and the Grenadines. Los datos de 1960 están ausentes. El número de observaciones reales por fecha: 56.
Fuente (nombre):
Indicadores del desarrollo mundial
Fuente (organización):
World Bank Staff estimates based on United Nations, World Urbanization Prospects.
Categorías:
Climate Change, Urban Development
Se ha actualizado:
23 abr 2017 año
Los indicadores de los cambios de valor en los últimos años
Mínimo:
21.0 mil
1 ene 1961 año
Máximo:
55.333 mil
1 ene 2016 año
A la fecha de observación
Valor
Cambio absoluto
El cambio con respecto al valor anterior
1 ene 1961 año
21.0 mil
+21.0 mil
0.0%
1 ene 1962 año
21.681 mil
+681.0
3.24%
1 ene 1963 año
22.342 mil
+661.0
3.05%
1 ene 1964 año
22.989 mil
+647.0
2.9%
1 ene 1965 año
23.635 mil
+646.0
2.81%
1 ene 1966 año
24.289 mil
+654.0
2.77%
1 ene 1967 año
24.954 mil
+665.0
2.74%
1 ene 1968 año
25.628 mil
+674.0
2.7%
1 ene 1969 año
26.316 mil
+688.0
2.68%
1 ene 1970 año
27.023 mil
+707.0
2.69%
1 ene 1971 año
27.755 mil
+732.0
2.71%
1 ene 1972 año
28.513 mil
+758.0
2.73%
1 ene 1973 año
29.299 mil
+786.0
2.76%
1 ene 1974 año
30.107 mil
+808.0
2.76%
1 ene 1975 año
30.933 mil
+826.0
2.74%
1 ene 1976 año
31.768 mil
+835.0
2.7%
1 ene 1977 año
32.613 mil
+845.0
2.66%
1 ene 1978 año
33.465 mil
+852.0
2.61%
1 ene 1979 año
34.325 mil
+860.0
2.57%
1 ene 1980 año
35.188 mil
+863.0
2.51%
1 ene 1981 año
36.052 mil
+864.0
2.46%
1 ene 1982 año
36.911 mil
+859.0
2.38%
1 ene 1983 año
37.767 mil
+856.0
2.32%
1 ene 1984 año
38.619 mil
+852.0
2.26%
1 ene 1985 año
39.474 mil
+855.0
2.21%
1 ene 1986 año
40.33 mil
+856.0
2.17%
1 ene 1987 año
41.193 mil
+863.0
2.14%
1 ene 1988 año
42.057 mil
+864.0
2.1%
1 ene 1989 año
42.911 mil
+854.0
2.03%
1 ene 1990 año
43.735 mil
+824.0
1.92%
1 ene 1991 año
44.518 mil
+783.0
1.79%
1 ene 1992 año
45.226 mil
+708.0
1.59%
1 ene 1993 año
45.691 mil
+465.0
1.03%
1 ene 1994 año
46.117 mil
+426.0
0.93%
1 ene 1995 año
46.518 mil
+401.0
0.87%
1 ene 1996 año
46.903 mil
+385.0
0.83%
1 ene 1997 año
47.274 mil
+371.0
0.79%
1 ene 1998 año
47.628 mil
+354.0
0.75%
1 ene 1999 año
47.984 mil
+356.0
0.75%
1 ene 2000 año
48.355 mil
+371.0
0.77%
1 ene 2001 año
48.754 mil
+399.0
0.83%
1 ene 2002 año
49.187 mil
+433.0
0.89%
1 ene 2003 año
49.652 mil
+465.0
0.95%
1 ene 2004 año
50.138 mil
+486.0
0.98%
1 ene 2005 año
50.626 mil
+488.0
0.97%
1 ene 2006 año
51.104 mil
+478.0
0.94%
1 ene 2007 año
51.571 mil
+467.0
0.91%
1 ene 2008 año
52.031 mil
+460.0
0.89%
1 ene 2009 año
52.477 mil
+446.0
0.86%
1 ene 2010 año
52.91 mil
+433.0
0.83%
1 ene 2011 año
53.33 mil
+420.0
0.79%
1 ene 2012 año
53.73 mil
+400.0
0.75%
1 ene 2013 año
54.115 mil
+385.0
0.72%
1 ene 2014 año
54.497 mil
+382.0
0.71%
1 ene 2015 año
54.899 mil
+402.0
0.74%
1 ene 2016 año
55.333 mil
+434.0
0.79%
Ranking de los países por los datos estadísticos actuales


Comentarios: